
Supplement Market Report 2026: the categories accelerating, the rising ingredients — and the opportunities most brands still don't see
The supplement market doesn't change from one year to the next. It changes every week.
The note that matters before any number: what you're about to read is a dated snapshot. By the time you reach this article, the market has already moved — that's precisely its thesis. The numbers below are kept as proof of what the radar sees; the live version of every table is in the application, recalculated daily. We'll show you, section by section, exactly where.
The starting point
In the supplement industry, the difference between a product that generates millions and one that sits in the warehouse isn't always the formula. Very often, it's the timing of the launch.
The brands that grow fast aren't necessarily the ones inventing new ingredients. They're the ones who notice first where consumer attention is moving — and adapt their offer before the market gets crowded.
The RavenBI radar now covers over 2,000 supplement brands from nine countries, over 1,500 of them running ads right now, with more than 1.5 million ads captured, updated daily (figures measured on 7 September 2026). The examples below are from the DACH market.
How we read the market
A category doesn't grow just because people talk about it more. Real growth shows when several signals appear at the same time:
- more active ads;
- new brands entering and new launches;
- ads staying active for months, in more and more variants;
- rising search demand.
When these signals arrive together, the market usually sends a single message: there is demand. A single, isolated signal is noise.
The categories: what the radar showed — and why it has already changed
Two snapshots, six weeks apart, tell the whole story:
In July, the strongest move in DACH was liver & detox: +117% new ads, across 16 brands — exactly the window where ad pressure is still low.
By late August, the radar no longer saw any category in clear acceleration: the DACH market was consolidating (−6% active ads versus the previous month), and cooling categories dominated — sexual health −82%, women's health −54%, beauty −53%, sleep −50% in new ads.
No annual report would have caught that turn. And that's exactly why the numbers above are useless as a shopping list — but valuable as proof that the window moves.
Where you see today's version: the Trends page. Market Movement shows your market's direction (active ads, new competitors, new products), Heating up / Cooling down shows the categories accelerating or cooling right now, and Category momentum gives the 10-week trend, with each category's stage. The reading rule stays the same: look at the base behind the percentage — +114% on 3 brands is an early signal, +12% on 43 brands is a market.
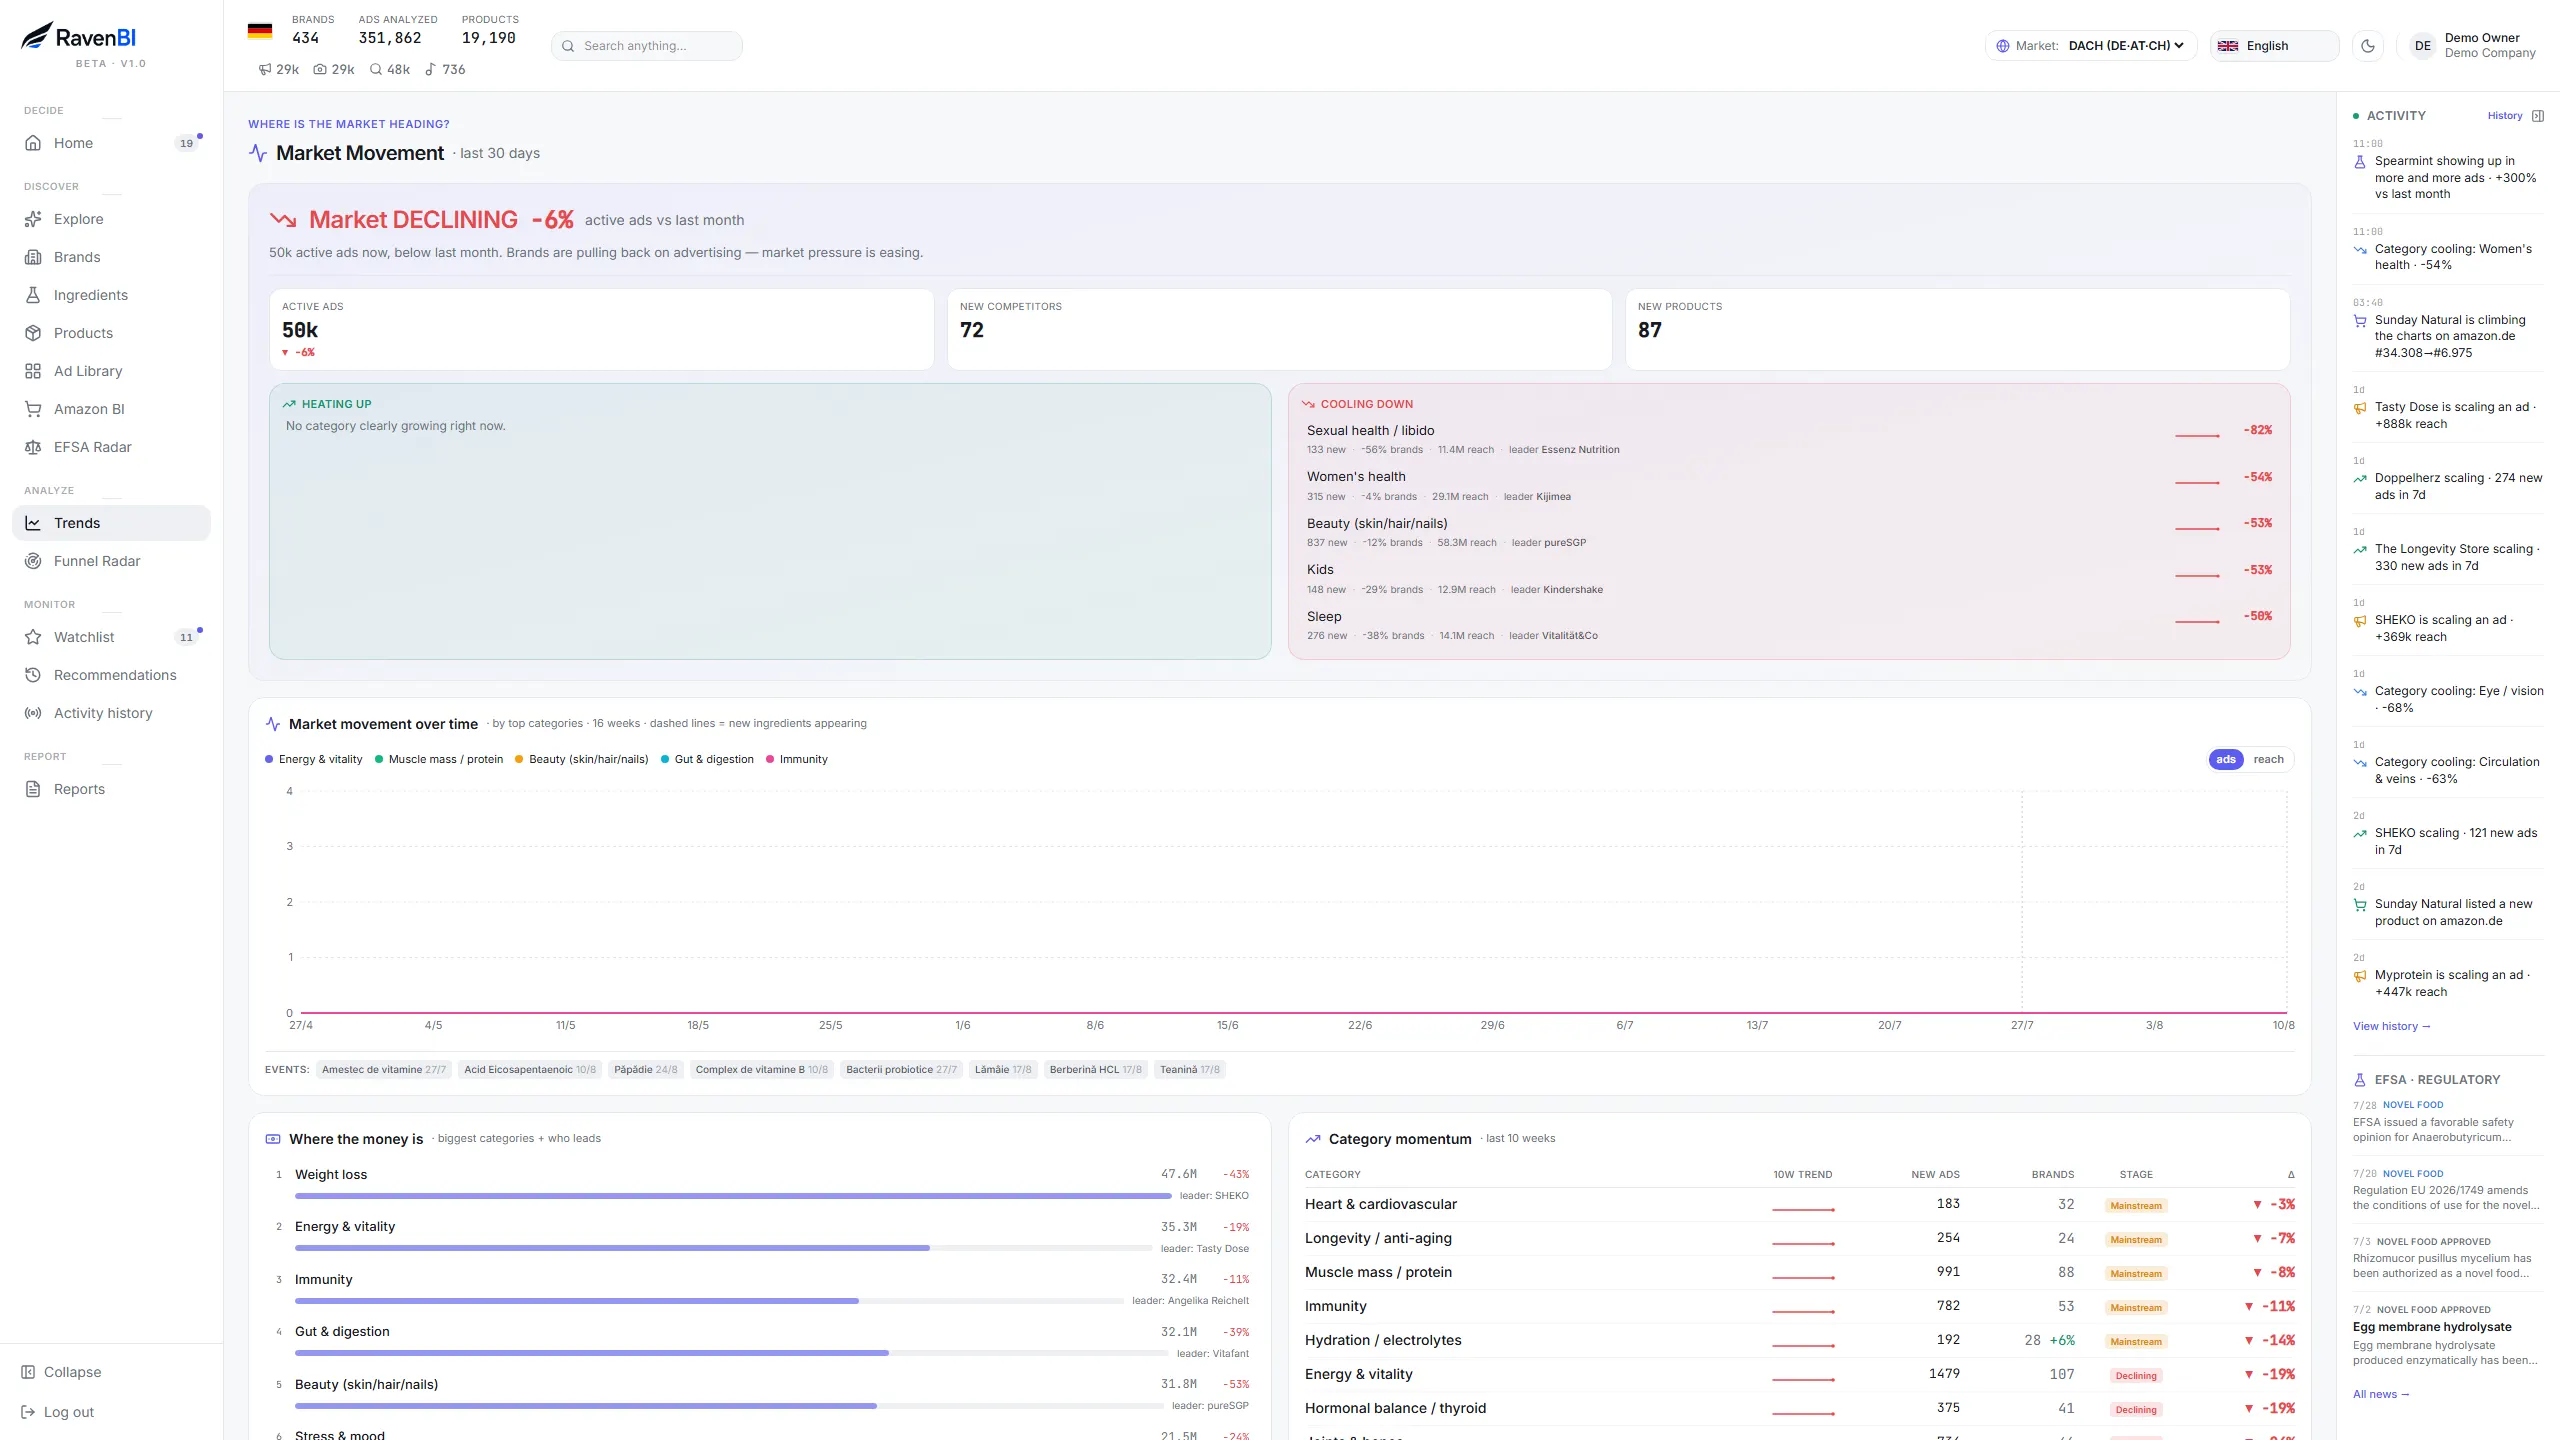
The late-August snapshot: no category clearly accelerating, broad cooling — a market in consolidation. Today's version is waiting in Trends.
The ingredients: the signal is read on three sources, not one
The trend engine combines three independent sources — ads, search demand and Amazon — and weighs them by confidence. An ingredient rising on all three is a different conversation from one rising only in ads.
One dated example, so you can see the shape of the signal: in July, the strongest signal on the radar was palmitoylethanolamide (PEA) — rising curves on all three sources and only 6 brands on the supply side. A signal to investigate, not a launch recommendation: novel food status must be checked before any step, and RavenBI flags exactly that on the ingredient's page.
The August snapshot already had a different top — and that's precisely the point: the list rewrites itself weekly, and the current version lives in the application, not in an article.
Where you see today's version: each Ingredient's page: Opportunity Score, market stage, competition and launch window, and right below, the key comparison — Consumer demand (searches, 16 weeks) side by side with Ad pressure (how many ads are running). The interesting case is demand↑ / ads↓. And If you launched tomorrow proposes a positioning hypothesis — category, audience, format, hook, offer — plus relevant authorised claims, to be validated before use.
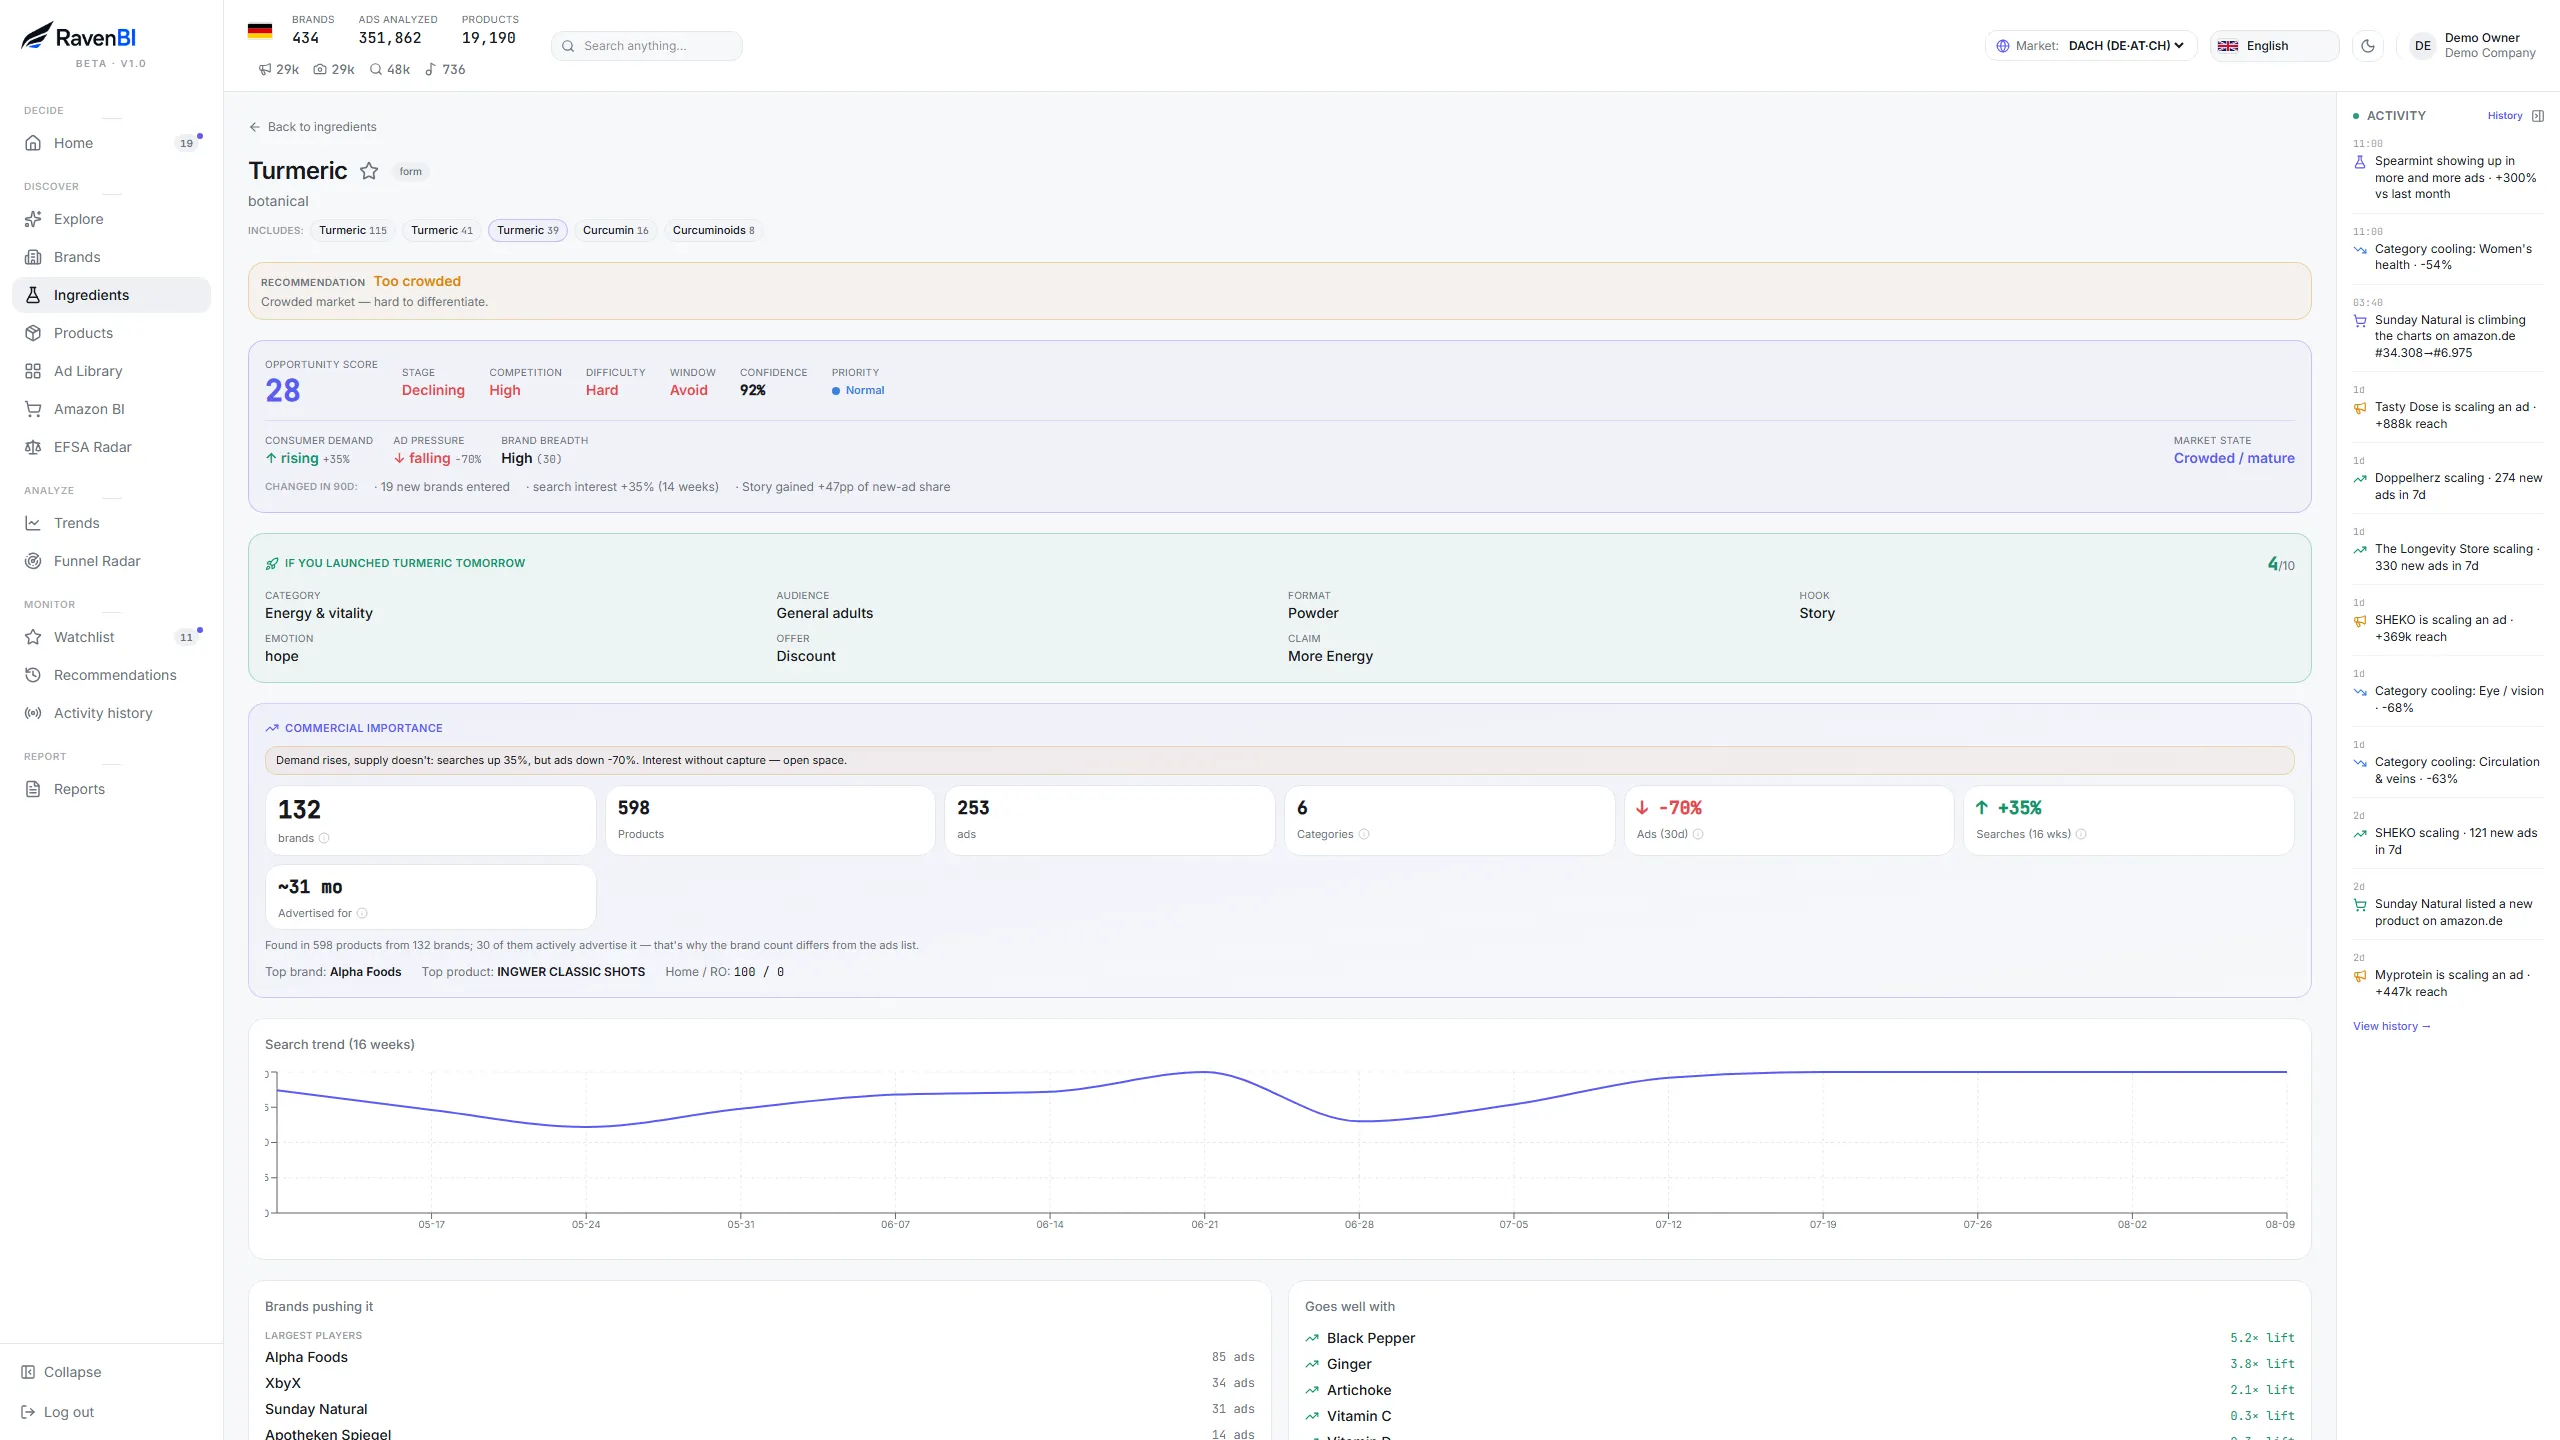
Demand vs. ad pressure, competition, window — an ingredient's full signal, on a single page.
The formulas: ingredients compete alone less and less
What gets combined is as telling as what rises. At the August snapshot, the radar was tracking 245 market-validated formulas in DACH — of which 19 growing and 143 in "white space": combinations including ingredients with relevant authorised claims that few competitors use. Which ones exactly — that's precisely the question an article doesn't answer.
Where you see today's version: Winning Formulas (in Explore): every formula with its score, the number of brands running it, the authorised claim it can rest on and the launch window, with filters for emerging / white-space / low competition / high ROI.
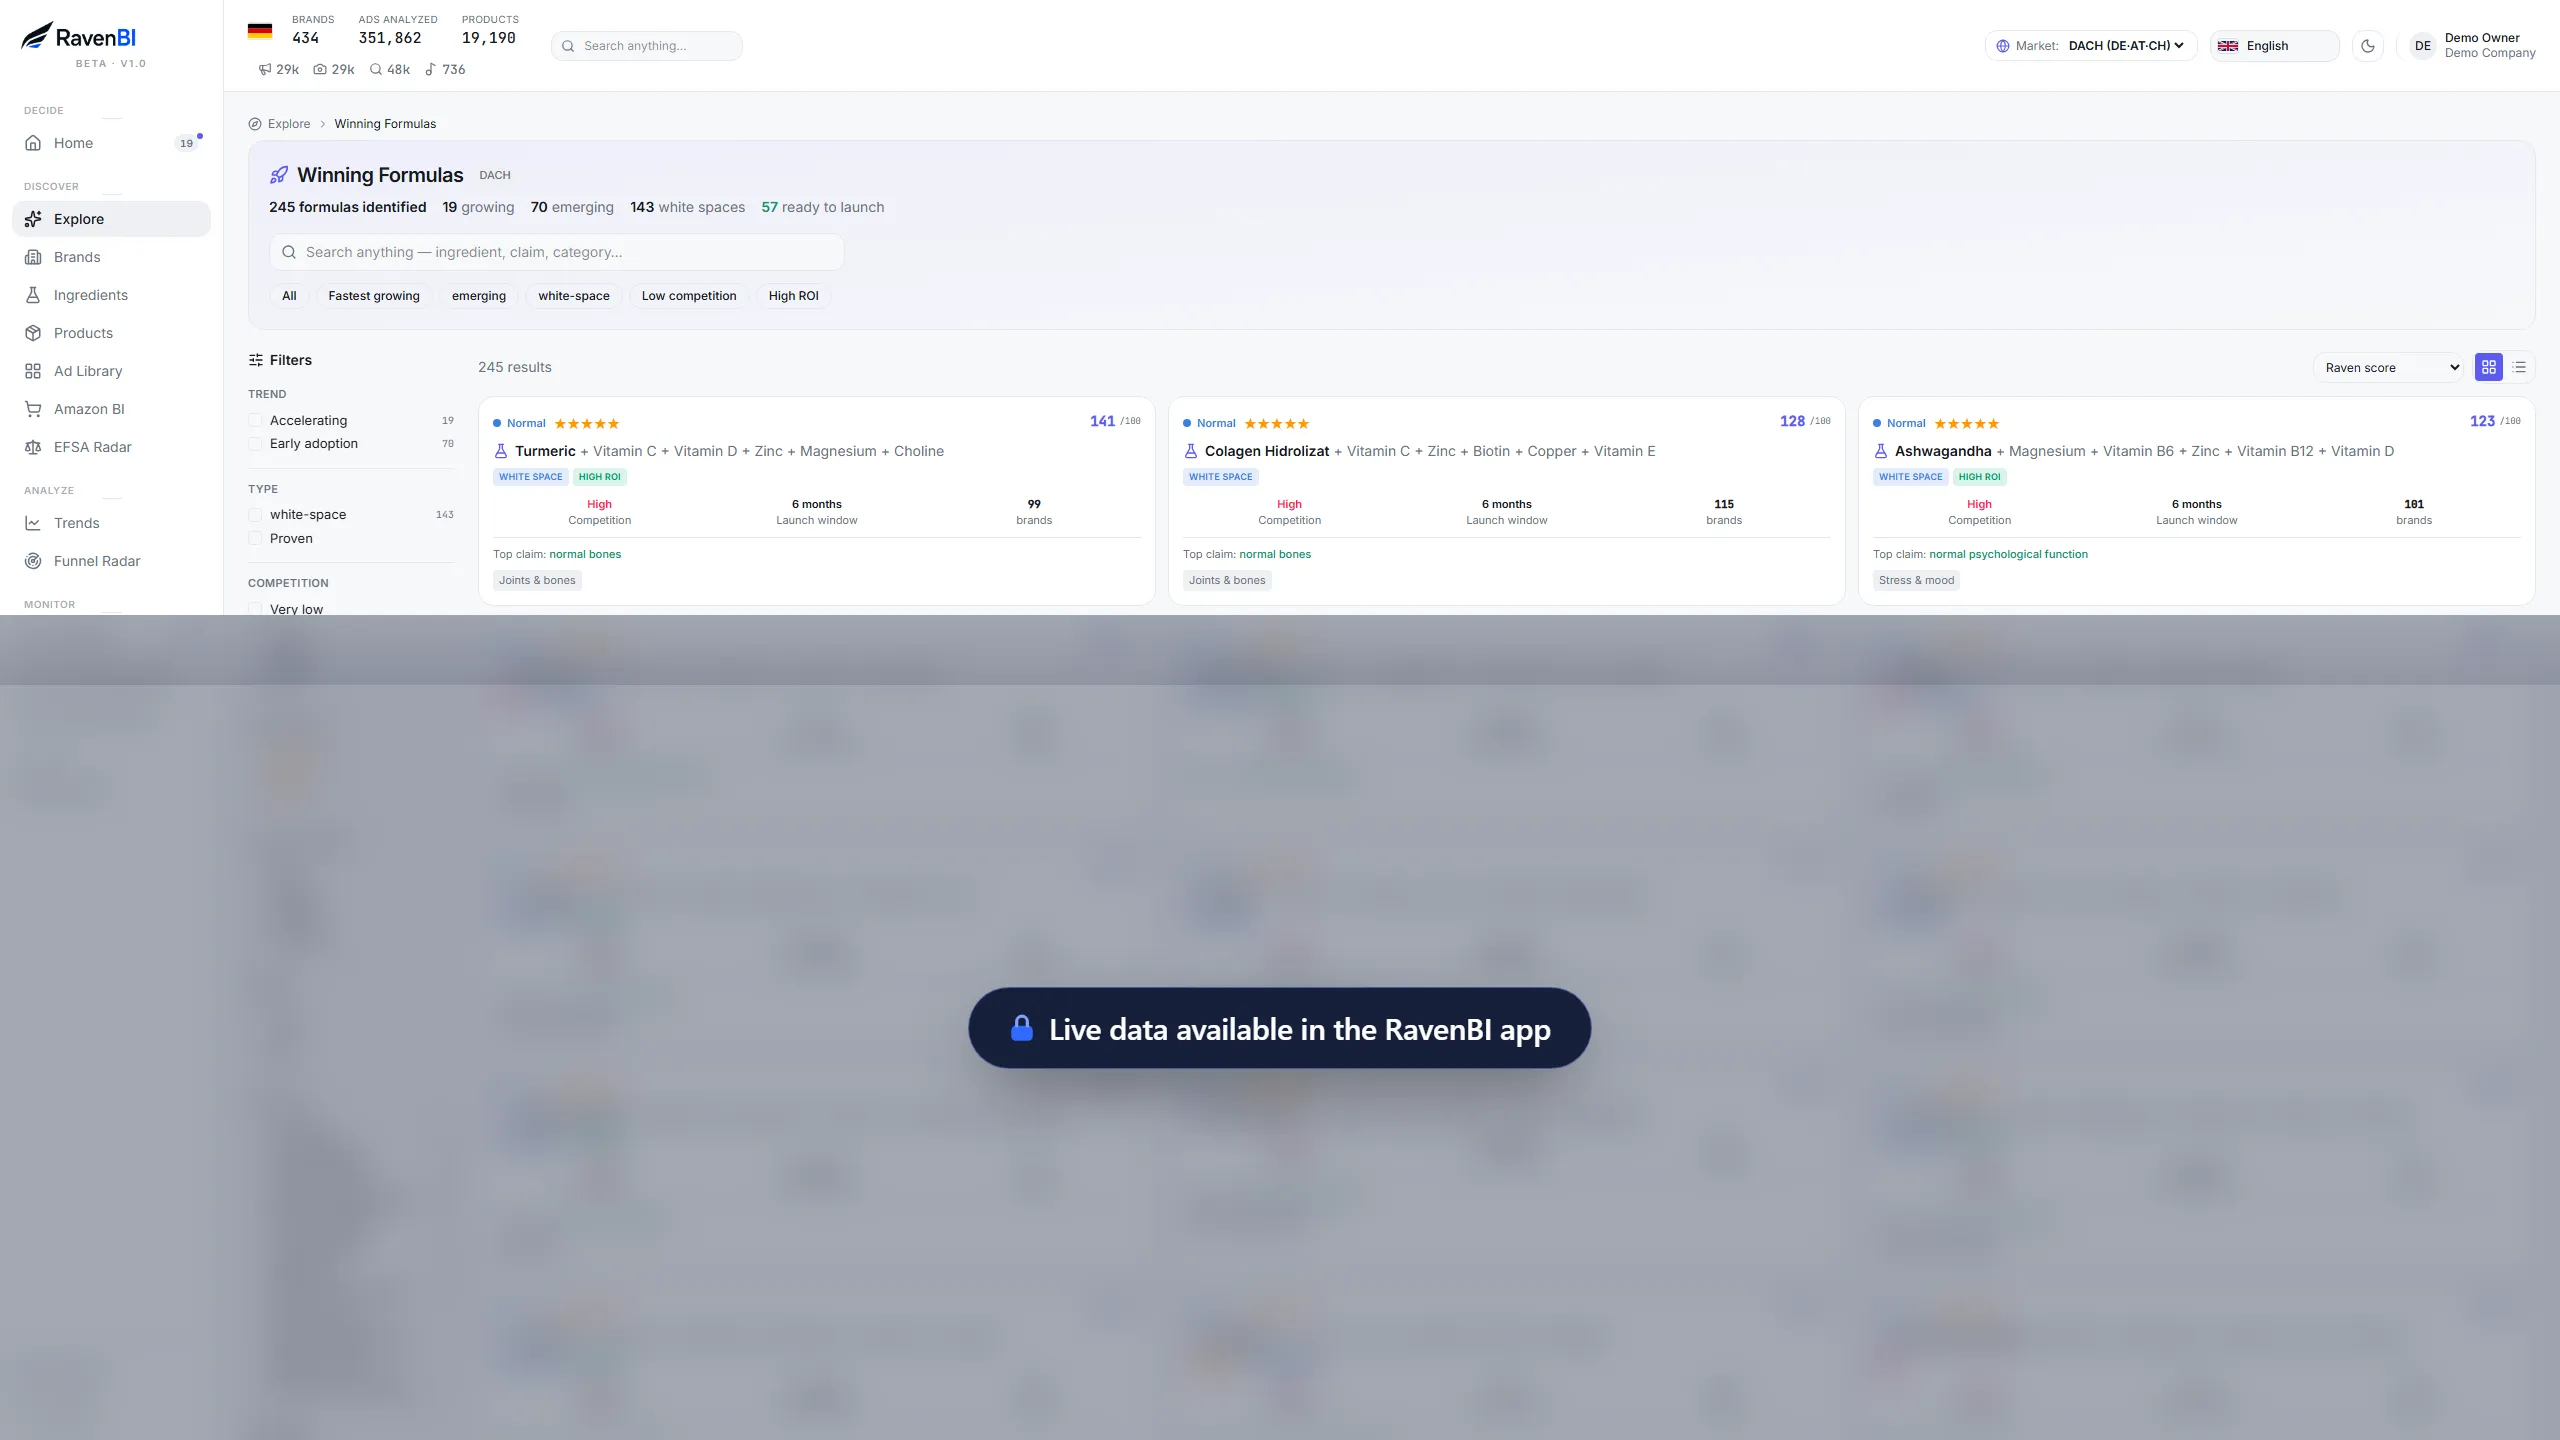
245 formulas identified in the market at the time of the snapshot — with claim, competition and window for each.
The claims gap: the differentiation that costs only information
The pattern in the August snapshot repeated across the whole market: many brands run ads on themes for which authorised health statements have existed in the EU for years — without using them. One example: of 99 brands converging on the same recipe around turmeric, 68 were not using any authorised claim in their ads.
Put correctly: that's not an accusation against anyone — it's a map of the places where the alignment between commercial messages and authorised claims is worth checking. If you build your formula so that an authorised claim comes bundled in, you can communicate — within the applicable conditions of use — a benefit that a large share of your competition doesn't. Final validation remains, as always, a conversation with a regulatory specialist.
Where you see today's version: the EFSA Radar (decisions per ingredient: approved or refused claims, novel foods, maximum levels, with summaries) plus the categories in Explore, which display directly how many brands run ads without an authorised claim on each theme.
How the ads themselves are changing
Marketing leaves traces in the data too. The most robust pattern in the summer snapshot: long-running ads carried the emotion "trust" 1.7× more often than average — references to doctors, certificates, plain-language argumentation instead of louder promises. And in offers, the plain price cut was losing ground to 2-3-month packs, subscriptions and guarantees.
Where you see today's version: in the Ad Library, every ad is classified by problem, format and age, and on each funnel the Psychology section shows the primary emotion, trust elements, urgency, hooks and detected angles. Compare a few long-running funnels from your category and see for yourself what repeats — in your market, not in the industry average.
What does this mean for a brand?
If you're planning to launch or extend your portfolio in 2026:
- Don't launch because an ingredient is popular — check whether interest is rising or already mature.
- Look at the base behind every percentage: +114% on 3 brands is an early signal; +12% on 43 brands is a market.
- Study competitors, messages and offers before you lock in the formula.
- Build the formula so an authorised claim comes bundled in — the claims gap is the differentiation that costs nothing but information.
- Launch timing can matter as much as the product itself.
Why continuous monitoring beats annual reports
The best argument is this very article: its July version praised the acceleration of liver & detox; six weeks later, the radar no longer saw any category clearly accelerating. Most market reports are published once a year. The market doesn't wait a year — and decisions made on old data mean missed windows.
Where you see today's version: Reports → Live Snapshot — the week's moves (who's accelerating, which formulas converge, which categories lose momentum), the market scoreboard and the executive summary, exportable as PDF or sent by email. And Watchlist + the Home page show you, on every visit, what changed since the last one — on the brands, ingredients and funnels you follow.
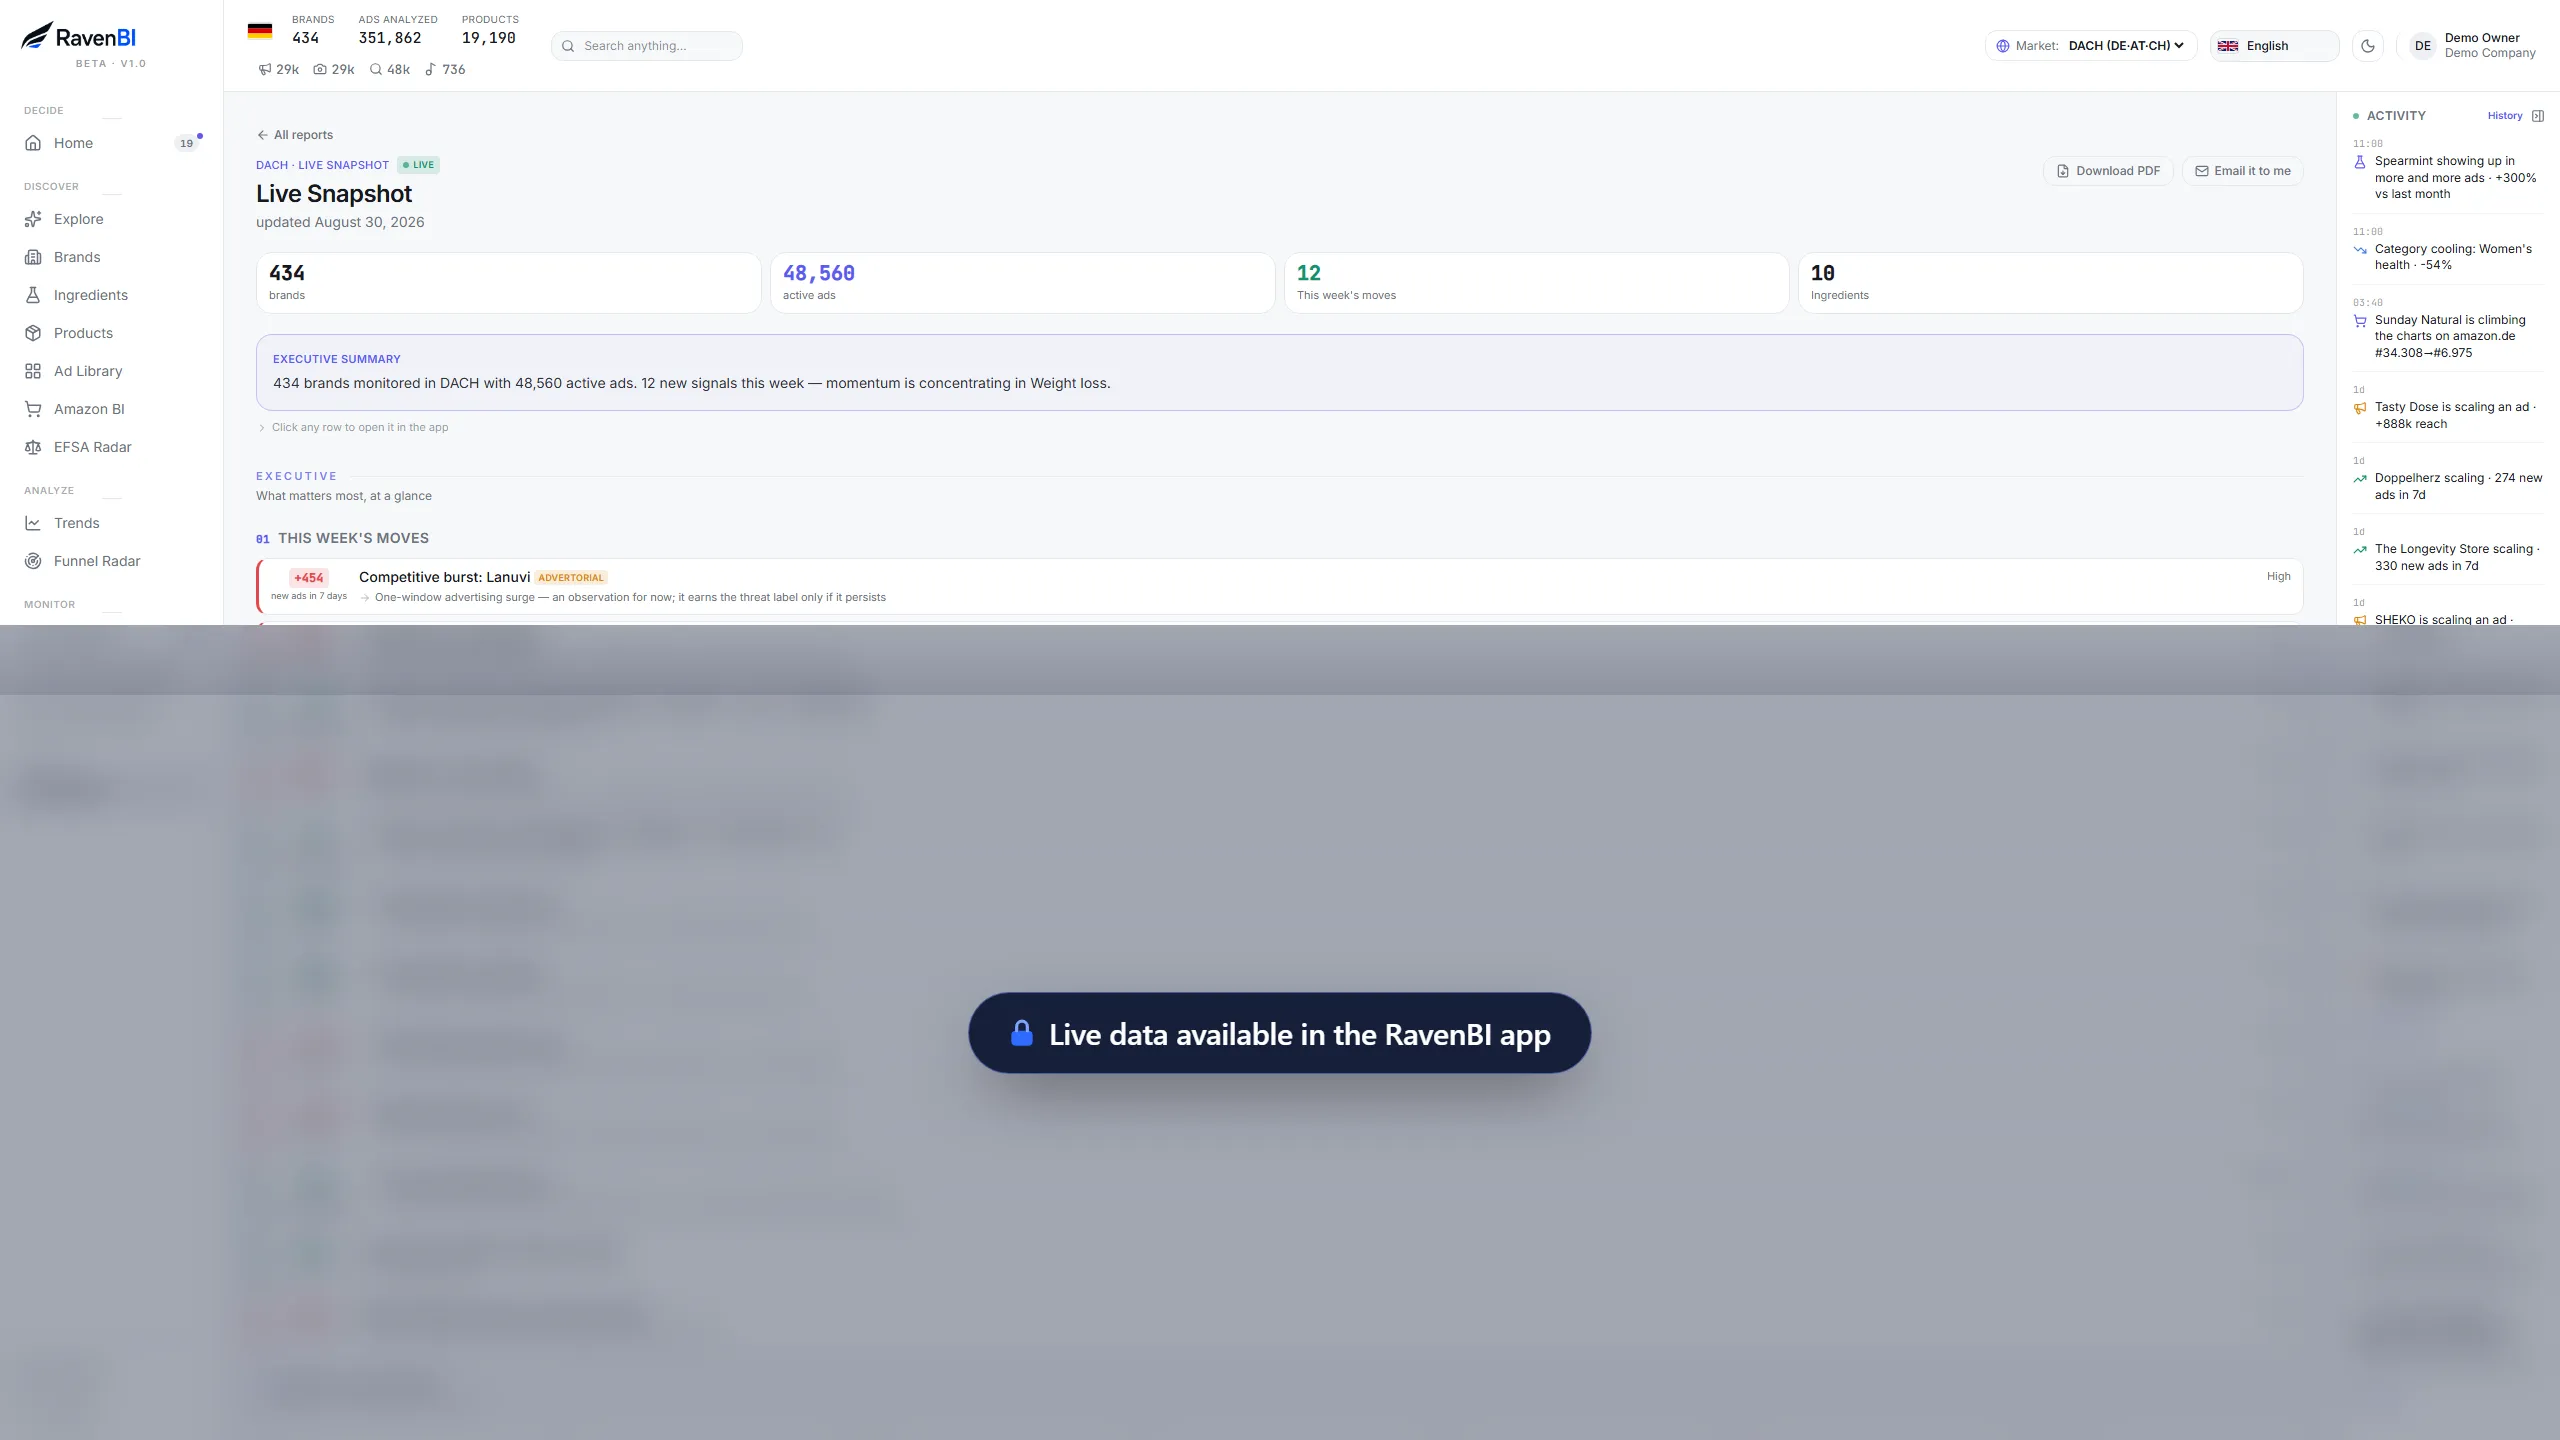
Live Snapshot: the week's moves, with their numbers — the report that never freezes.
Conclusion
The supplement industry gets more competitive every year — but also more readable for those tracking the right data. Categories, ingredients and marketing strategies leave visible traces before the change becomes obvious to the majority.
A report — including this one — can only show you what the market looked like on a given date. The advantage doesn't come from reading someone else's snapshot; it comes from looking at the live version, for your category, before every decision.
In the supplement market, the advantage doesn't belong to whoever reacts first. It belongs to whoever sees the change before others notice it.
RavenBI PRO watches the supplement market for you — every ad, every funnel, every trend. From €149/month, cancel anytime.
See plans & pricing