
How to validate a product before investing €50,000 in inventory
Most supplement brands don't fail because they have a bad product. They fail because they chose the wrong product.
The starting point
Dozens of new supplement brands appear every month. Some grow spectacularly within a few months — others disappear without ever recovering their initial investment.
In most cases, the problem isn't product quality. The problem is that the launch decision was made on gut feeling.
Many founders start from ideas like:
- "I think this ingredient will work."
- "I've seen a few Facebook ads about it."
- "The manufacturer says it sells really well."
- "Everyone is launching collagen right now."
The reality: the market already provides all the signals you need. You just have to know where to look.
In this article we show you how to validate a product before investing tens of thousands of euros in production, labels, inventory and advertising — and, at every step, how to do it concretely in RavenBI.
Step 1: Check whether the market and category are actually growing
The first question is not:
"Do I like the product?"
But:
"Is the category this product belongs to growing?"
An excellent ingredient can be a bad investment if market interest is declining.
If you observe that:
- the number of active ads is rising;
- new brands are entering the category;
- existing ads keep running for months;
- new products keep appearing in the category;
there's a good chance the category is in a growth cycle.
If, on the contrary, you see fewer and fewer ads and fewer launches, the market may already be saturated — or in decline.
How to do this in RavenBI: open the Trends page. The Market Movement section shows how the selected market is evolving — active ads, new competitors, new products — while the Heating up / Cooling down areas and the Category momentum table tell you, for each category, whether it's accelerating, stagnating or cooling off, with the trend over the last 10 weeks.
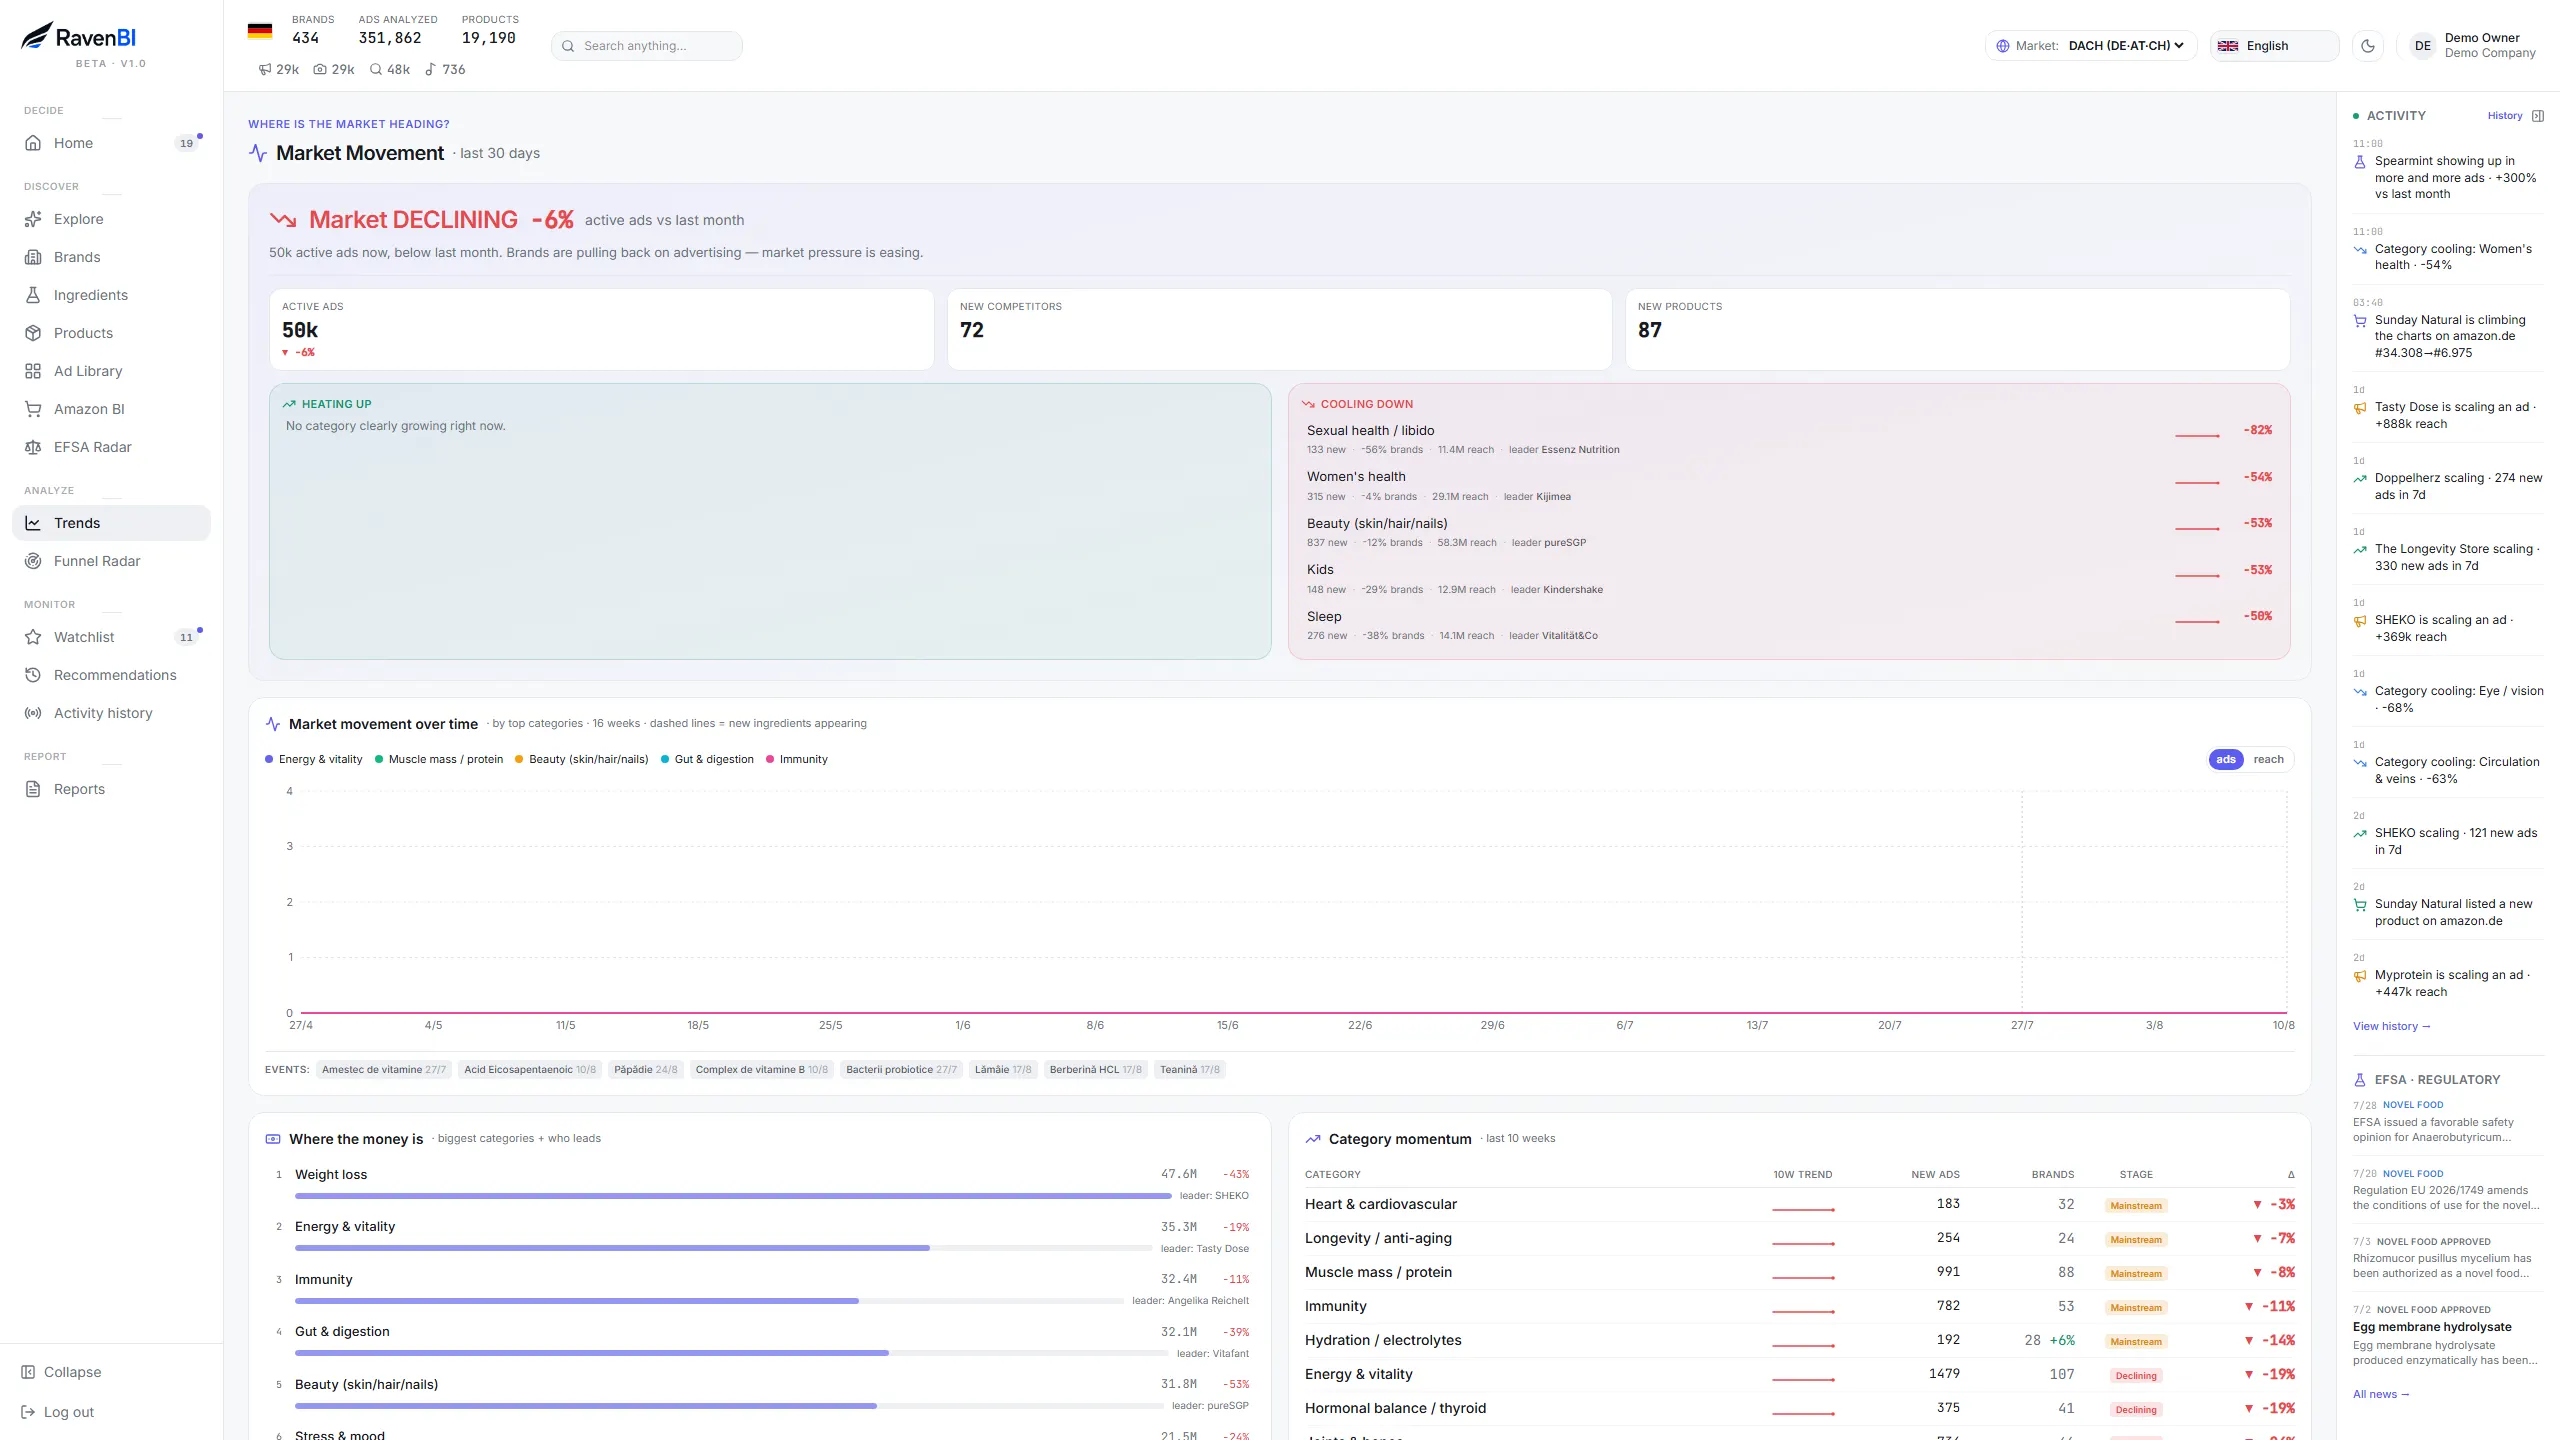
Category trends from real ad data: what's accelerating, what's cooling down, where the money goes.
Step 2: Spot the ingredients that are just starting to grow
Not all opportunities are obvious. Sometimes an ingredient starts showing up in more and more ads months before it becomes popular.
The combination worth hunting for is easy to state and hard to find manually:
- search demand for the ingredient is rising;
- ad pressure on it is falling or flat.
Growing interest with no ads capturing it means open space. The reverse — lots of ads on declining demand — means you're arriving late to an already crowded market.
How to do this in RavenBI: open the ingredient's page. At a glance you see the Opportunity Score, market stage, competition level and launch window, and right below, exactly the comparison above: Consumer demand (16-week search trend) side by side with Ad pressure (how many ads are running). The If you launched tomorrow section even proposes the positioning: category, audience, format, hook, emotion, offer and claim.
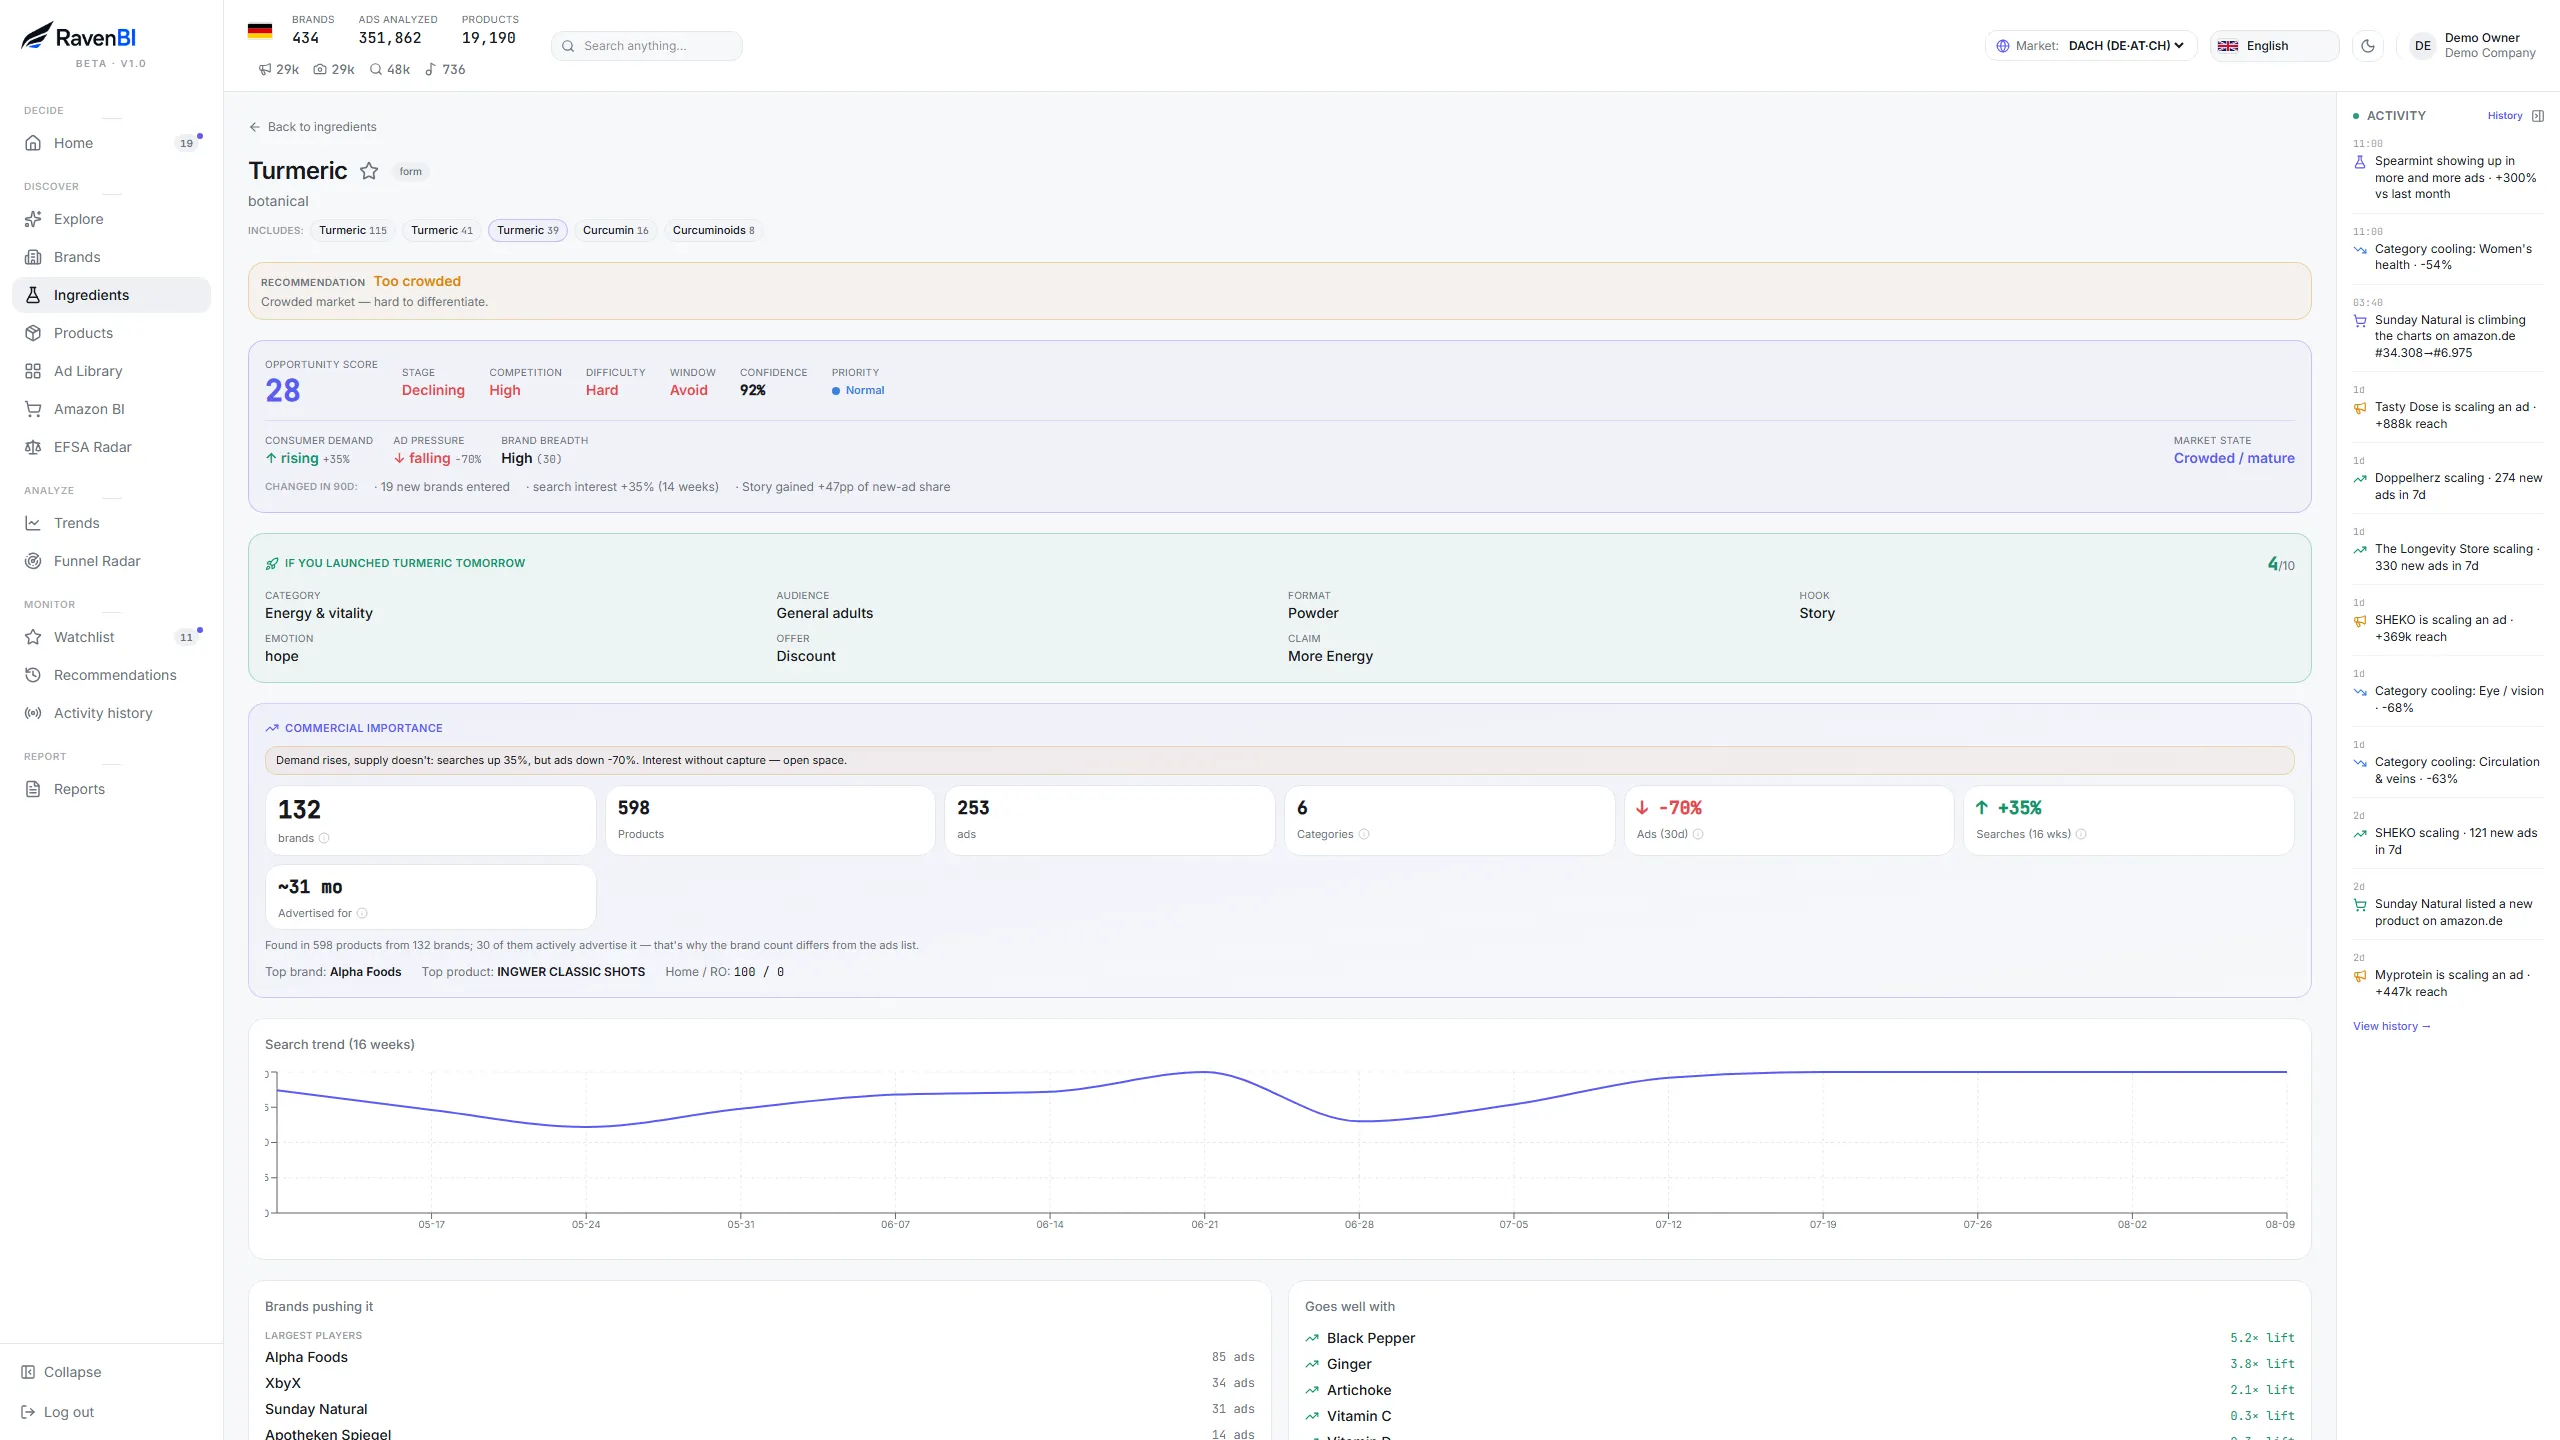
Rising demand + falling ad pressure = an open window. Or, as here: a crowded market, best avoided — a conclusion that saves you real money too.
Step 3: Check what you're legally allowed to promise
A step almost everyone skips — and one that decides your marketing in the EU: authorised health claims.
Which health statements are permitted for an ingredient is regulated at EU level, based on EFSA's assessments. This has two practical consequences:
- A booming ingredient without an authorised claim forces you into vague marketing — while legal risk grows.
- An ingredient with an authorised claim that almost no competitor actively uses is a positioning opportunity: you can communicate a permitted benefit that others aren't exploiting yet.
Before you invest, check what promise your packaging and ads can legally carry. It's part of the question of whether the formula is, in the end, marketable.
How to do this in RavenBI: in the EFSA Radar you search for the ingredient and see the relevant decisions — approved or refused claims, novel foods, maximum levels — each with a summary. And in Winning Formulas you see the formulas winning in the market, the authorised claim they can rest on, and where white space exists: combinations with a valid claim that few competitors use.
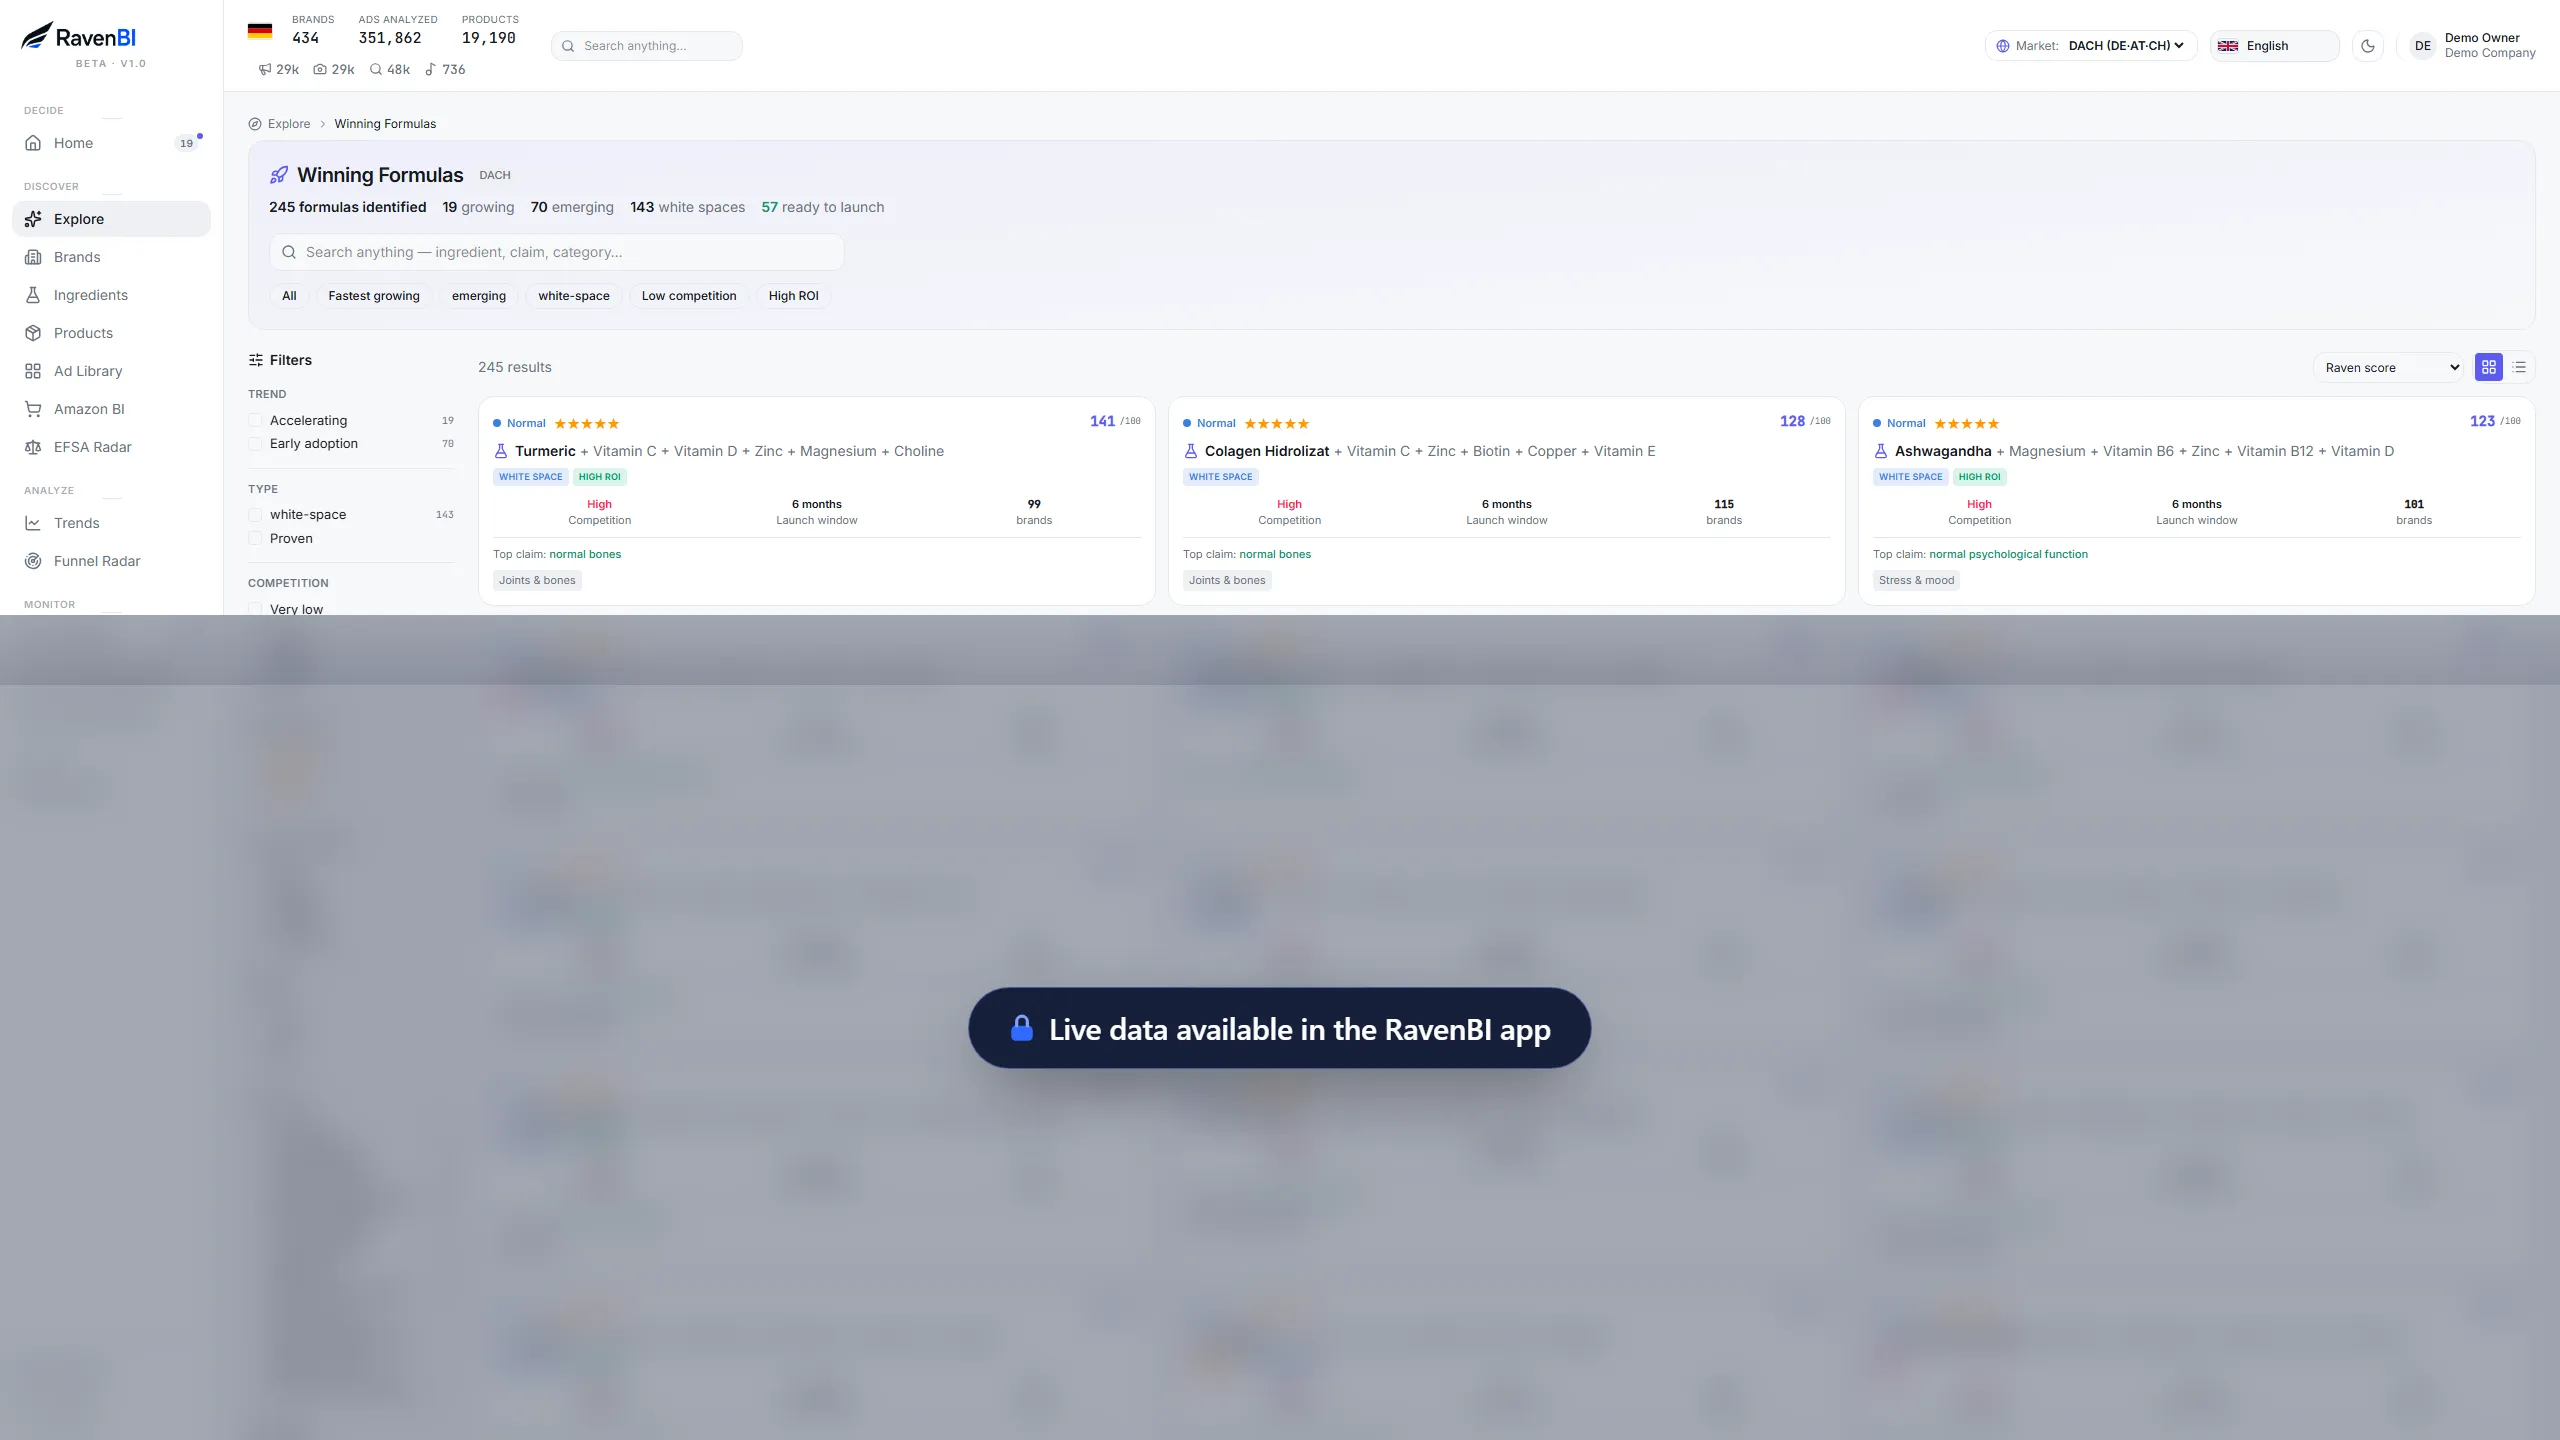
Market-validated formulas, with their authorised claim and how crowded they are — the gaps are flagged as white space.
This data helps you quickly identify what's allowed and what isn't — the final validation of your label and ads still belongs in a conversation with a regulatory specialist.
Step 4: Follow your competitors' money
One of the most valuable signals is simple:
Where do the big brands keep insisting with their budgets?
Companies running ads at scale optimise their budgets constantly. If several competitors are promoting the same type of product at the same time, that's a strong signal of real demand.
Don't copy the product. Understand why they're investing.
Ask yourself:
- What problem does it solve?
- Who is it addressed to?
- What promise do they use?
- What differentiator do they communicate?
How to do this in RavenBI: on the Brands page you see every brand in your market, with position (Leader / Challenger / Emerging), momentum, active ads and its latest move. The Leaders, Fast movers and New entrants tabs separate who dominates, who's accelerating and who's just entering. From the list, you open any brand's page and see its ads, products and funnels.
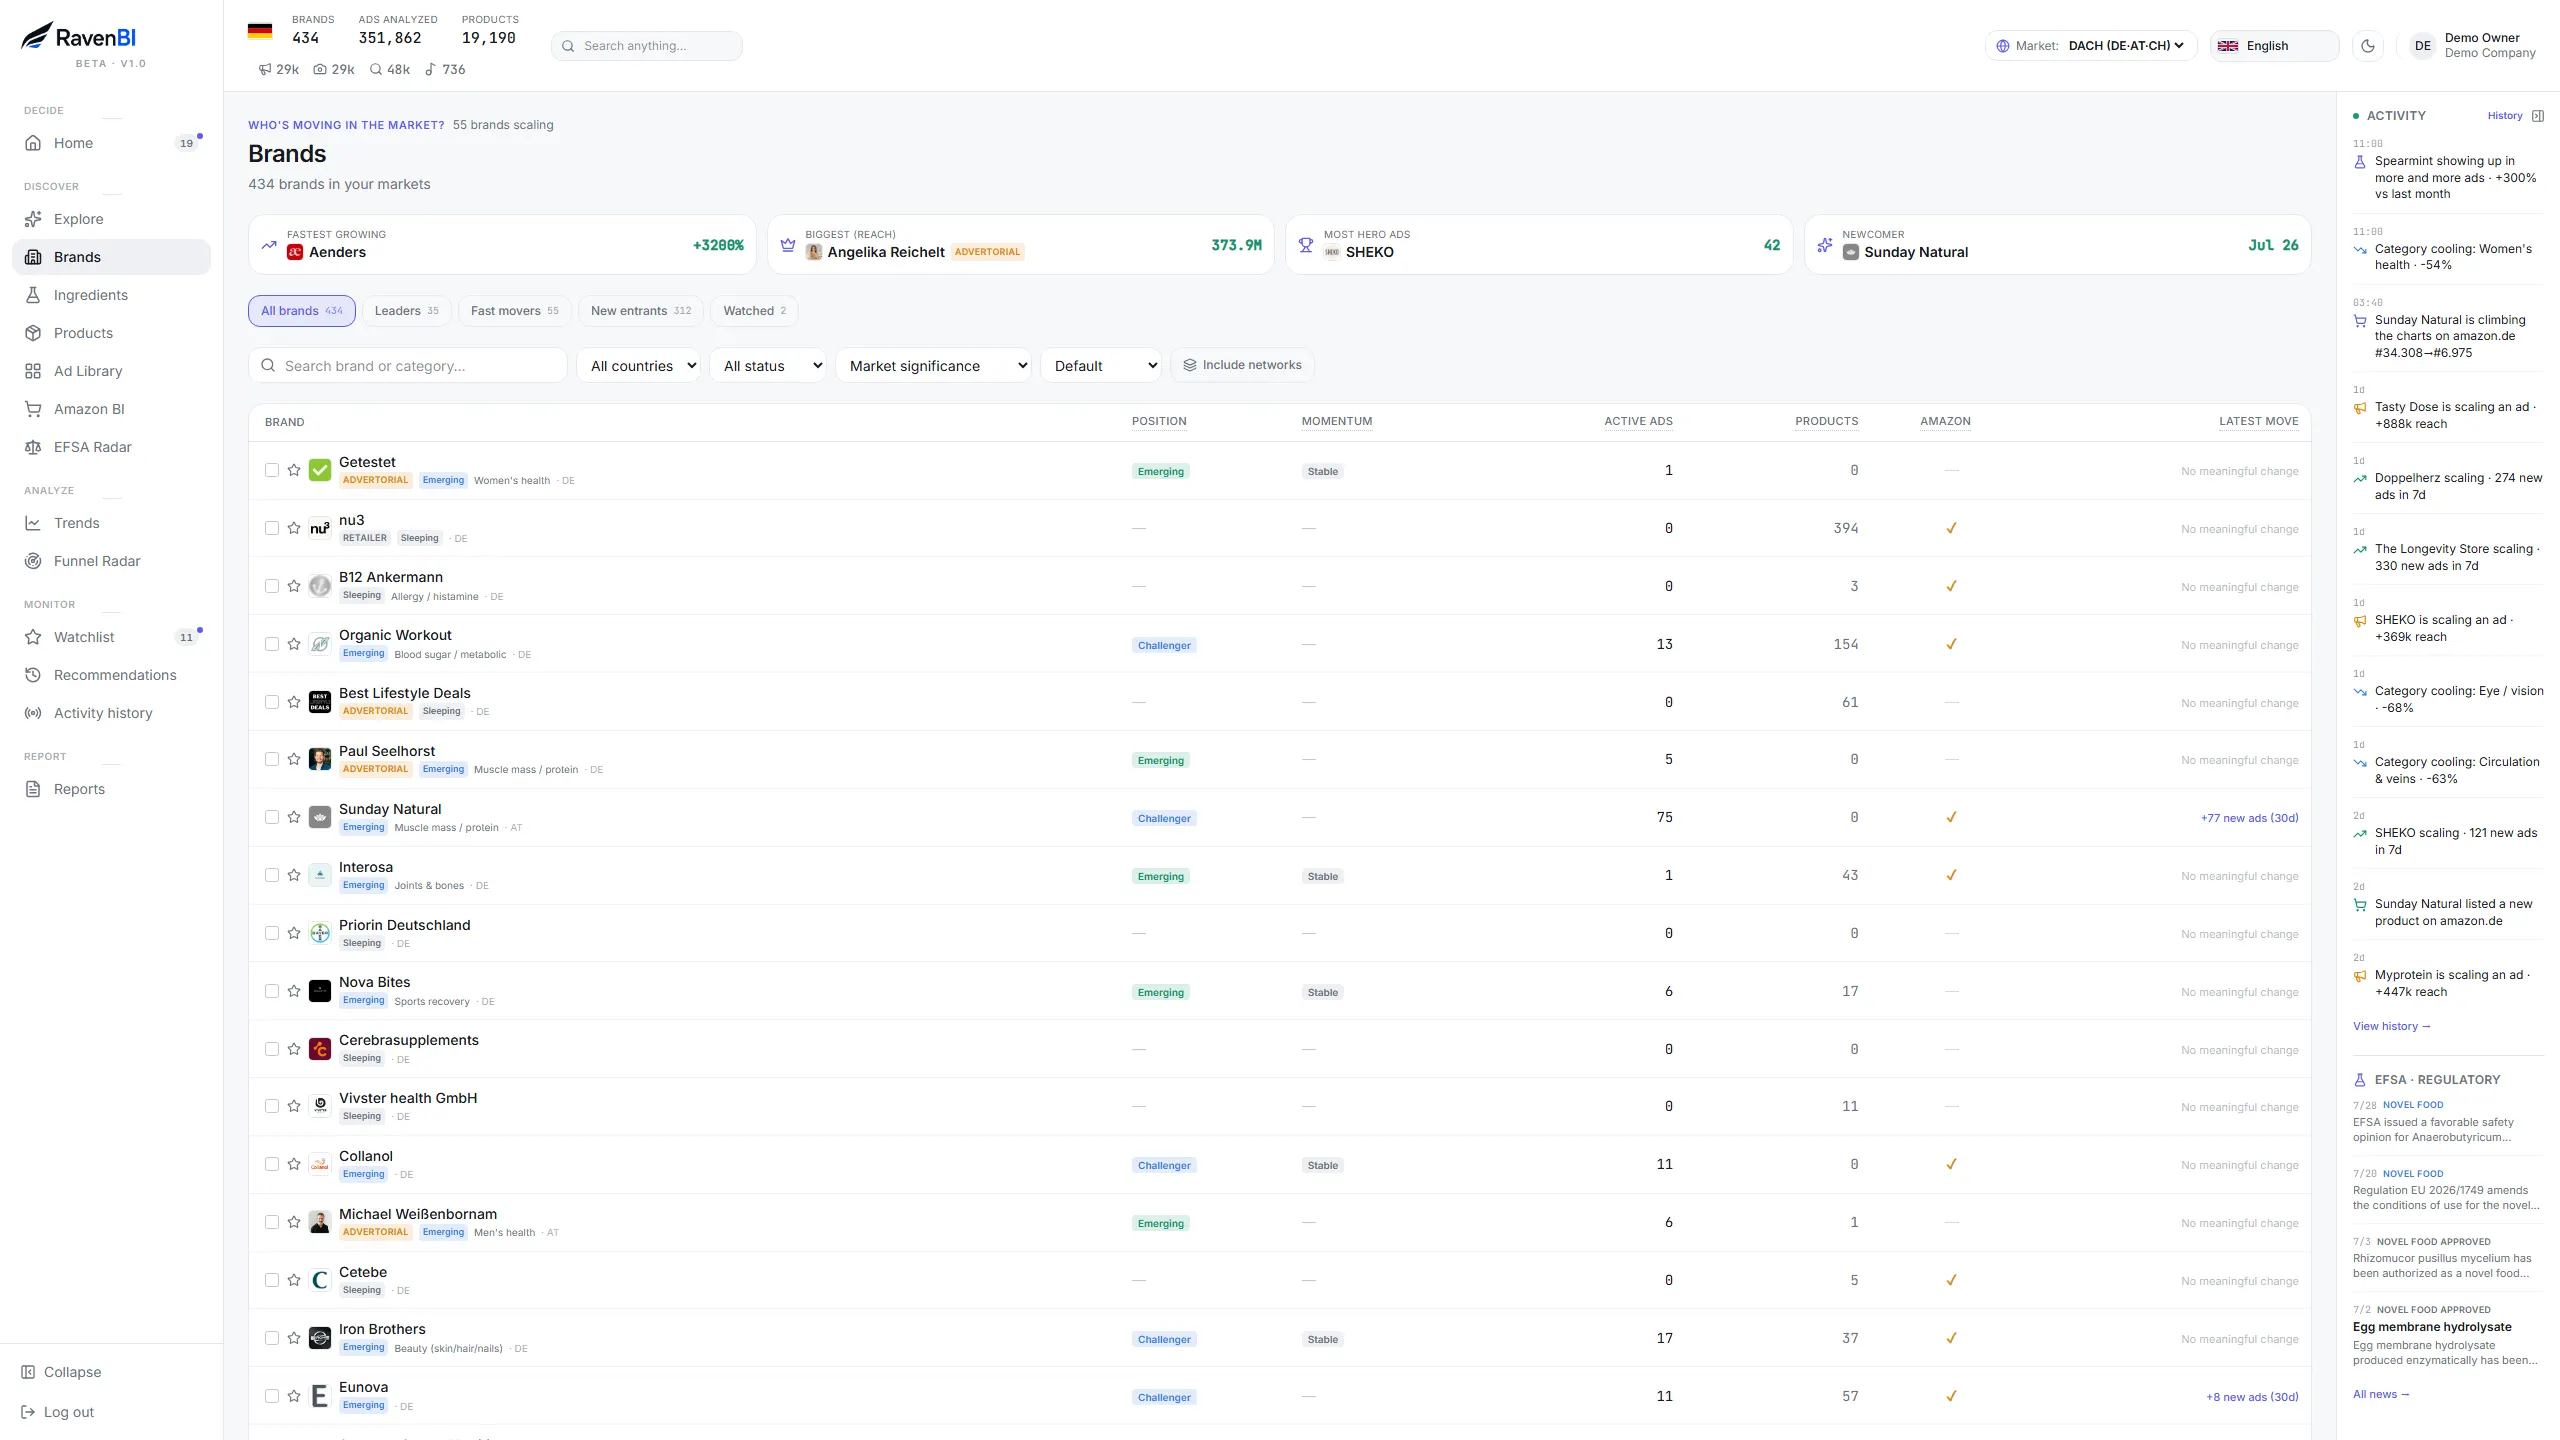
Who's accelerating, who's asleep, who launched new ads in the last 30 days — on a single page.
Step 5: Look at how long the ads have been running
One of the most common mistakes is copying an ad that appeared yesterday.
A new ad doesn't mean an ad that works.
Ads that have been running for 60, 90 or even 180 days are a much stronger signal. Longevity is a useful indicator: brands tend to switch off quickly the ads that don't justify their investment.
How long an ad has been running often says more than how it looks.
How to do this in RavenBI: in the Ad Library, every ad displays its age in days, its status (active or not), estimated reach and how many variants are running in parallel. The Scaling filter highlights ads with scaling signals right now — growing reach, multiple variants — and the default sort combines longevity with reach: exactly the ads that have made it past the testing phase.
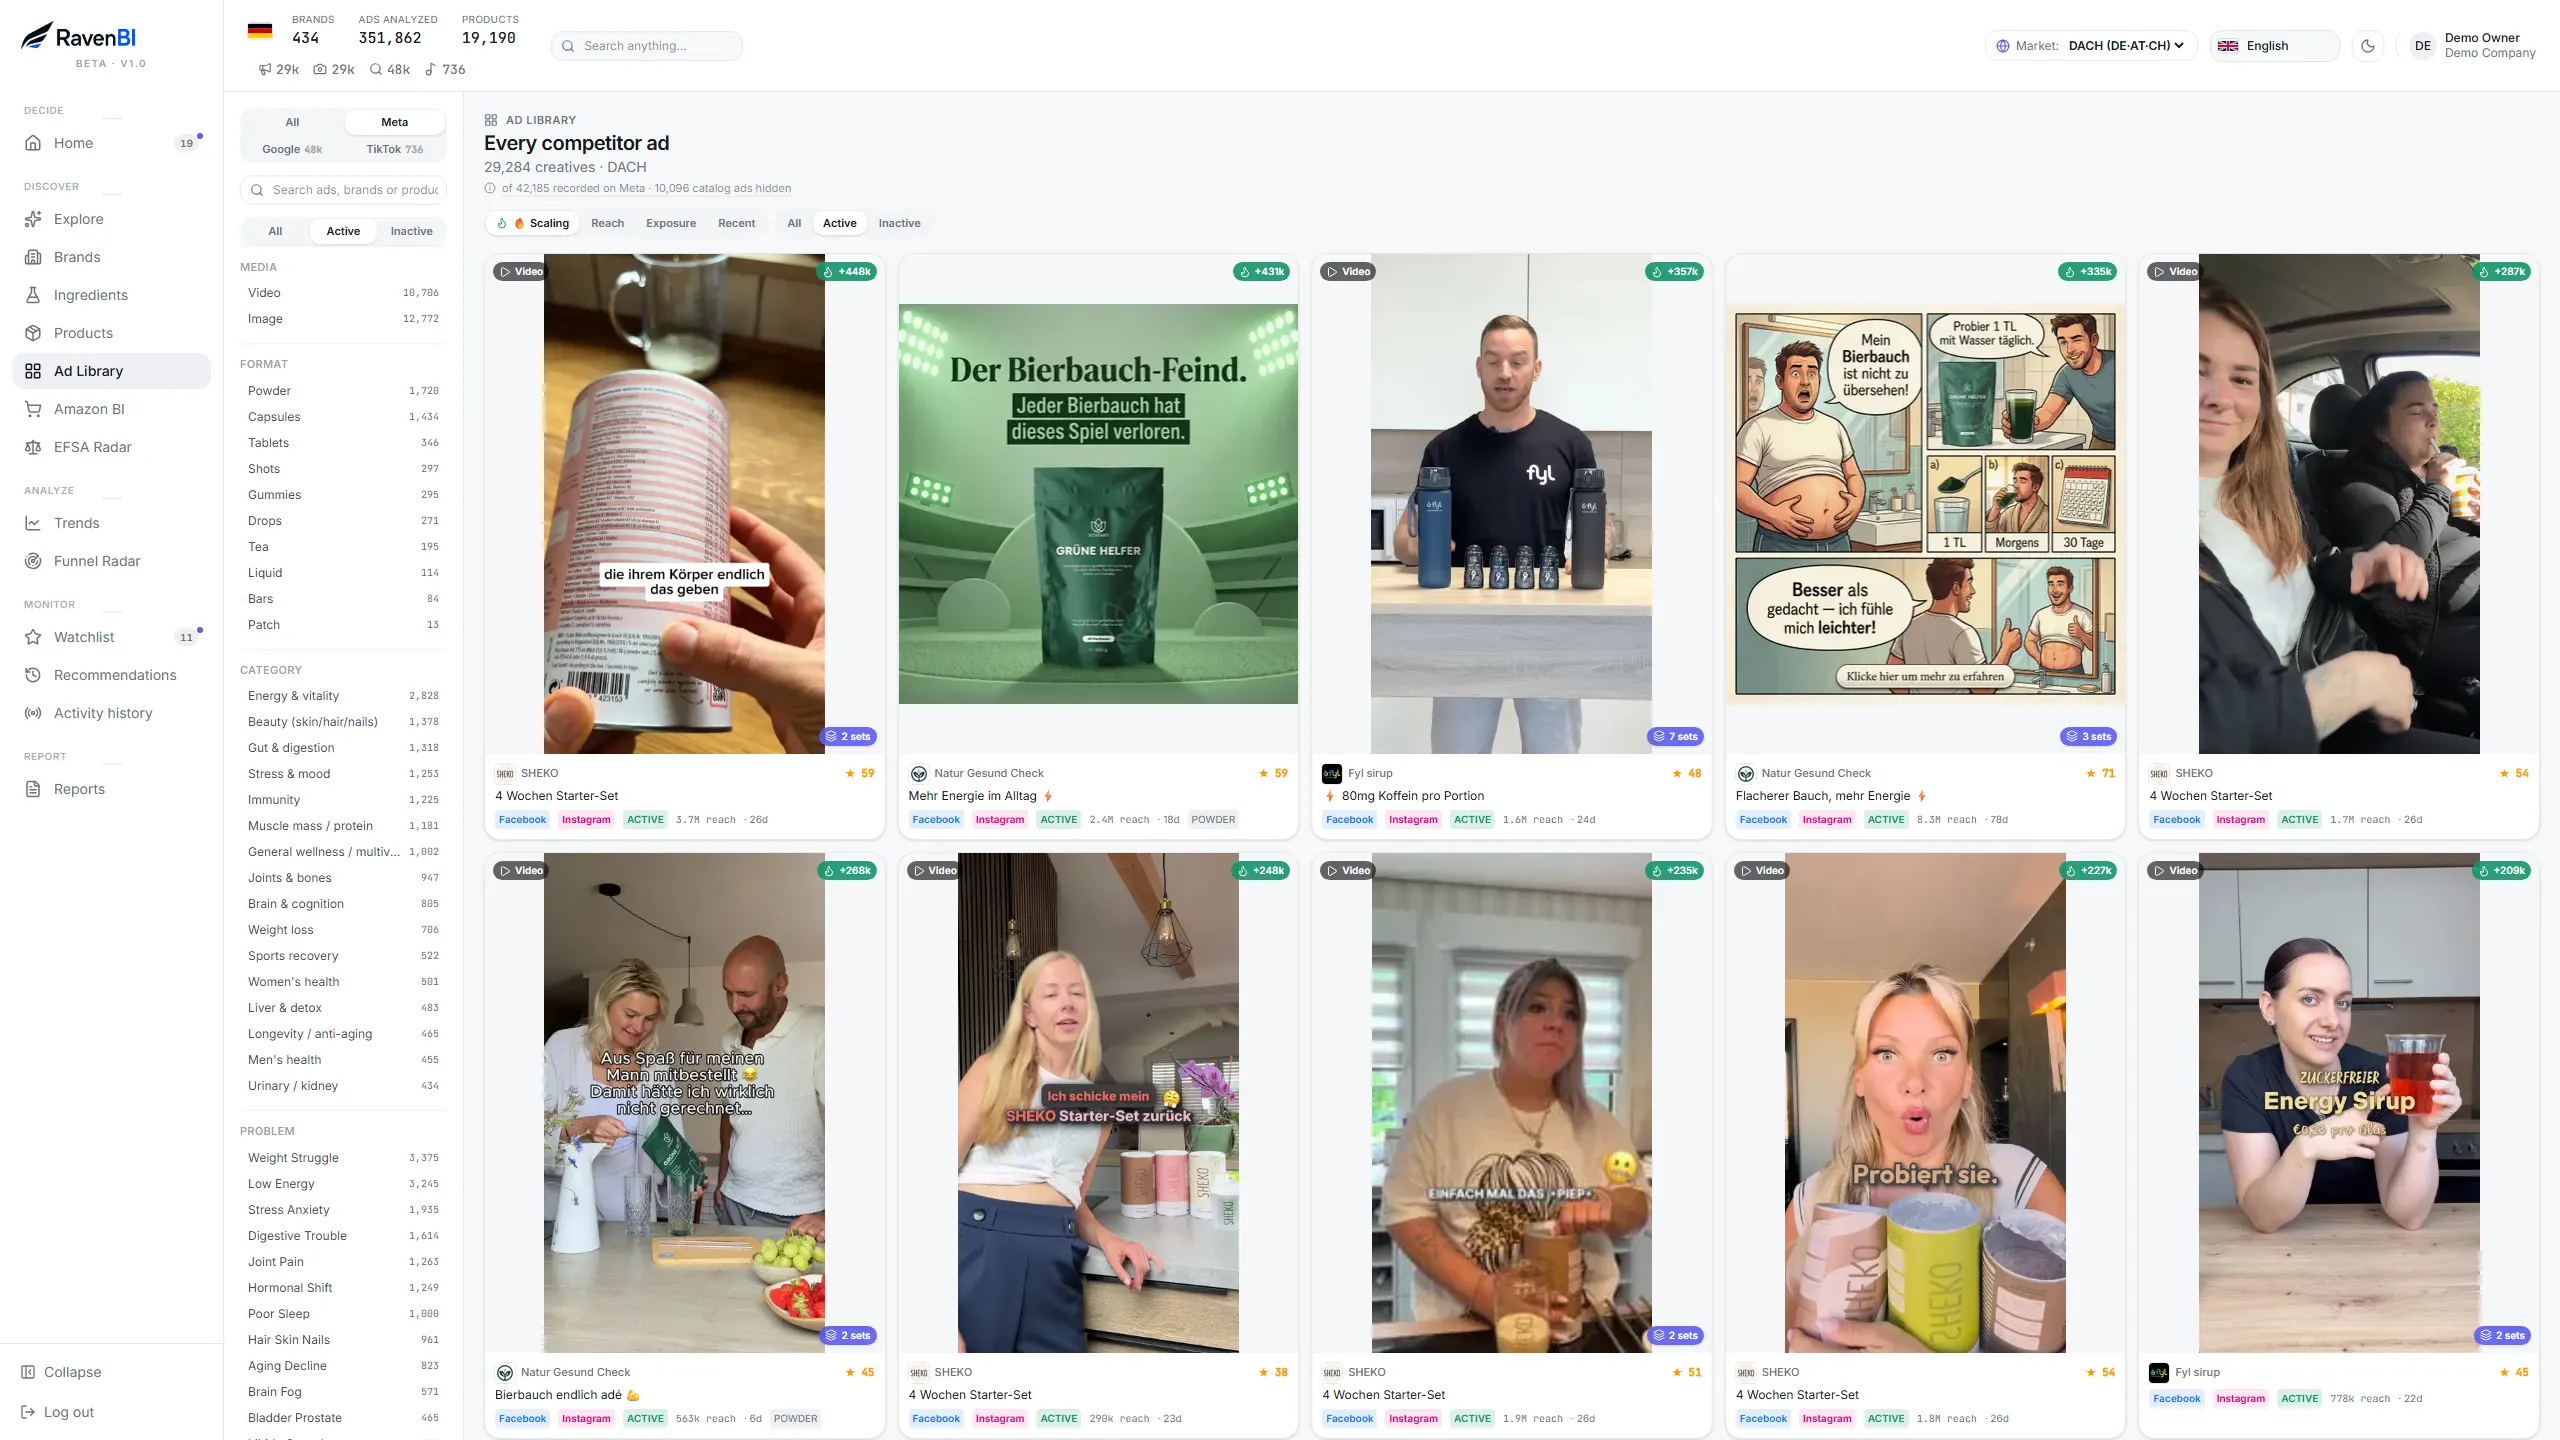
Every ad's age and reach in plain sight — short tests separate themselves from campaigns that stay active for months.
Step 6: Study the messages that sell
The first thing a customer buys is not the product. It's the promise.
Analyse:
- the headline;
- the first image;
- the first 3 seconds of the video;
- the problem presented;
- the emotions used;
- the proof offered.
Then ask yourself: why would someone stop scrolling here?
The best ads don't talk about ingredients. They talk about results.
How to do this in RavenBI: you don't have to deconstruct every ad by hand — each one is already classified: which problem it attacks, which category, which format. In a funnel's analysis, the Psychology section shows the primary emotion, the trust level, the urgency, and the hooks and selling angles detected. And in Explore you can also go the other way: from a hook or a problem to every ad using it.
Step 7: Look beyond the ad
Many people analyse only the ad. But the conversion happens on the landing page.
Check:
- the page structure;
- the offer;
- the guarantees;
- the testimonials;
- the social proof;
- the CTAs;
- the FAQ section.
Sometimes two identical products get completely different results just because of the sales page.
How to do this in RavenBI: the Funnel Radar takes apart the landing page behind the ad: a conversion score broken down by component (landing, trust, offer, urgency, copy, checkout), the page structure section by section, the trust elements detected, the weaknesses and — the most practical part — the How to beat this funnel list: where the page is vulnerable and what you could build a better one with.
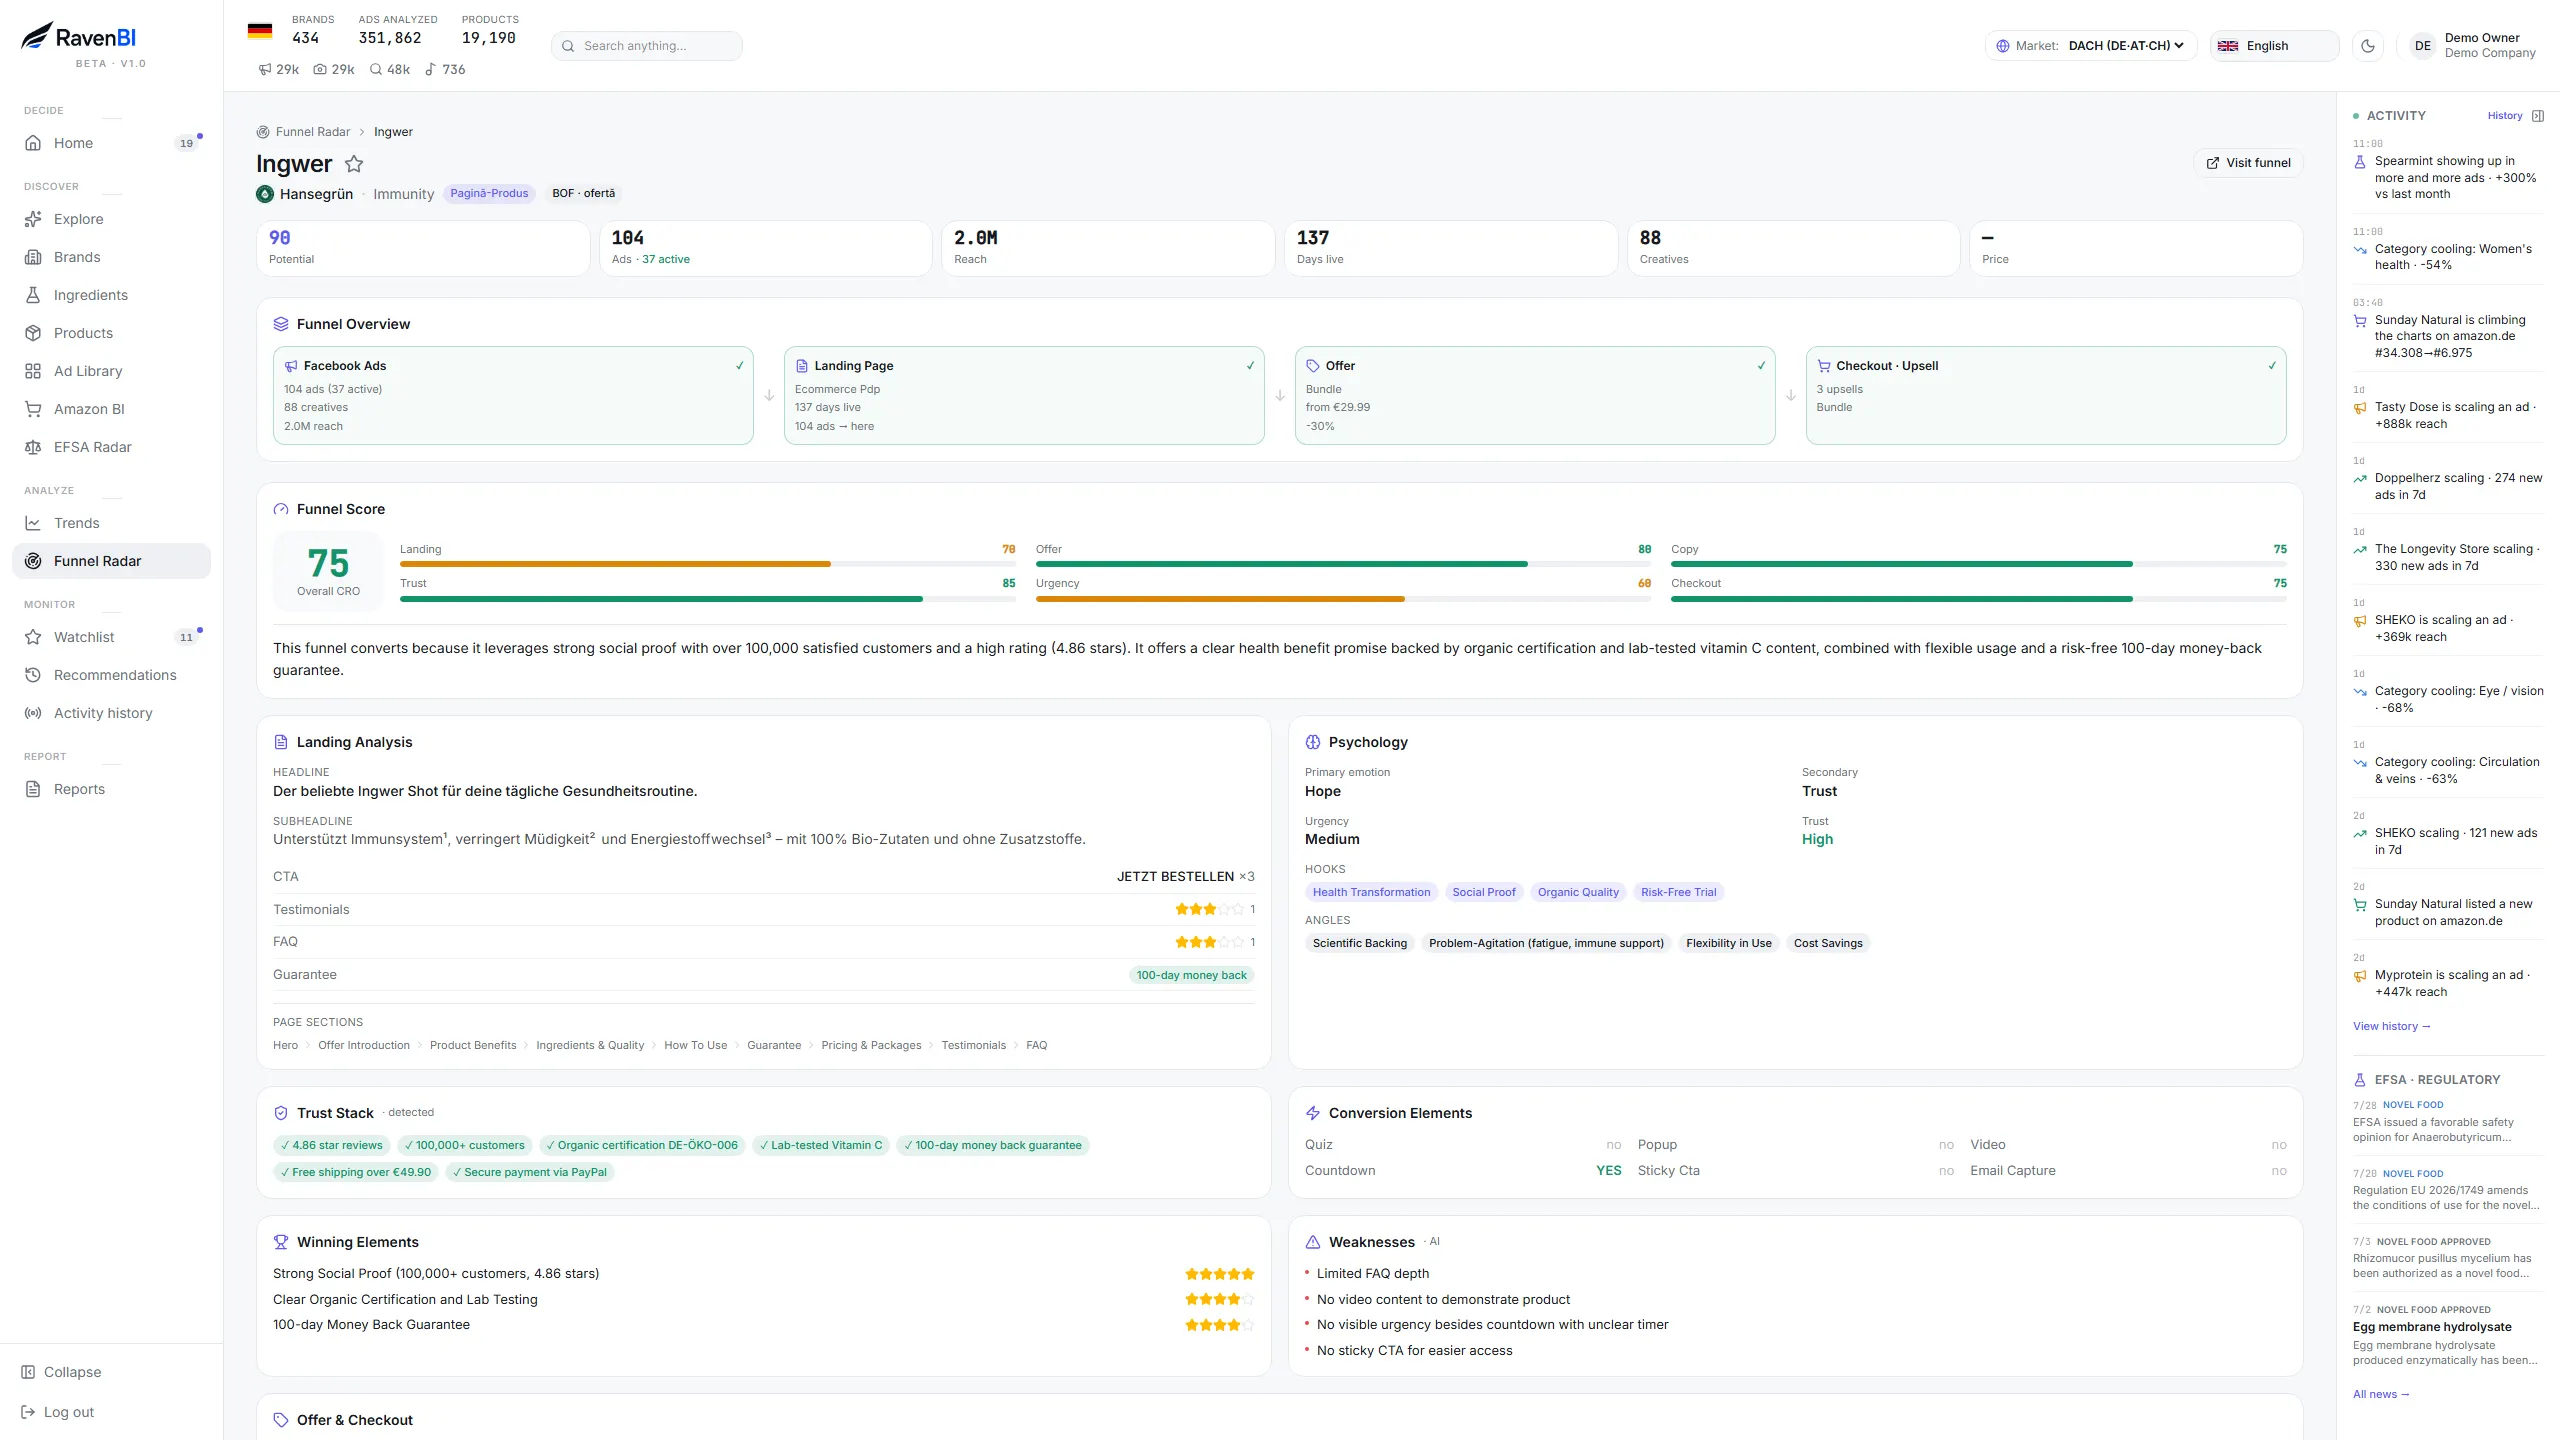
Funnel Radar: the structure, offer, trust elements and weak points of competitors' landing pages — broken down by component.
Step 8: Analyse the offer and the price, not just the product
A good product launched with the wrong offer can fail.
For the funnels that have been running a long time, study:
- the displayed price and the "slashed" price;
- the discounts;
- the packs and bundles;
- the checkout upsells;
- the subscriptions, where the funnel offers them;
- the guarantees supporting the price.
You'll notice that many winning brands do not compete on the lowest price. They compete on perceived value.
How to do this in RavenBI: on every funnel's page you see the price, the discount, the bundle and the checkout upsells, plus the change history — when the brand changed its offer, headline or price. And in Explore, the Contrarian price signals surface products positioned far from the category's price median whose ads nevertheless keep holding — usually the most interesting place to learn from.
Step 9: Gather the signals and make the decision
Before launching, you should be able to answer a few simple questions:
- Is the market growing?
- Does the ingredient have rising demand and open space?
- What authorised claim can your formula carry?
- Are there competitors investing consistently — and how long have their ads been running?
- What messages and funnels do they use?
- Can you build a better offer?
If the answers are clear, the chances of a successful launch grow significantly.
One important thing: market data validates demand and competition. Margin, production costs and logistics remain your internal calculation — no tool can validate them for you.
How to do this in RavenBI: Reports → Live Snapshot gathers the week's moves and the market scoreboard into a single report, exportable as PDF. And after the decision, validation doesn't stop: you put the relevant brands, ingredients and funnels on your Watchlist, and the Home page shows you, on every visit, what changed since the last one — the market moves daily, and you find out on day one, not three months later.
Manual research takes days. Sometimes weeks.
To validate a single product properly, you have to go through dozens of sources:
- the Meta Ad Library (formerly Facebook Ads Library);
- online shops;
- landing pages;
- analytics platforms;
- Google Trends;
- marketplaces;
- competitors' websites.
The process is slow and hard to repeat. And the information changes daily.
How RavenBI simplifies this process
RavenBI centralises the essential signals of this process in a single platform — over 2,000 supplement brands from nine countries (Germany, Austria, Switzerland, the United Kingdom, France, Spain, Italy, Romania and the United States), with more than 1.5 million ads captured, updated daily (figures measured on 7 September 2026).
In a few minutes you can see:
- which categories are growing and which are cooling down;
- which ingredients are gaining ground — in ads and in search demand;
- which health statements are authorised in the EU for a formula — and who uses them (or doesn't);
- which brands invest consistently and which ads have been running for months;
- which hooks the winning brands use;
- how their funnels are built — structure, offer, guarantees, FAQ;
- where opportunities appear before they become obvious to the rest of the market.
Instead of basing your decisions on intuition, you base them on real market data.
Conclusion
Launching a new product shouldn't be a bet.
In an industry as competitive as food supplements, access to the right information makes the difference between a product that sits in the warehouse and one that generates sales from the very first months.
The better you validate the market before launch, the lower the risk — and the higher the chances you're investing in the right direction.
Data doesn't guarantee success. But it significantly reduces the number of decisions made by guessing.
RavenBI PRO watches the supplement market for you — every ad, every funnel, every trend. From €149/month, cancel anytime.
See plans & pricing